
Grafana
This page describes how to set up the Rockset Grafana plugin.
Introduction
Grafana is an open-source platform for analytics and monitoring. Using Grafana with Rockset is ideal for creating visualizations on your Rockset Collections and plotting timeseries data.
Configuration
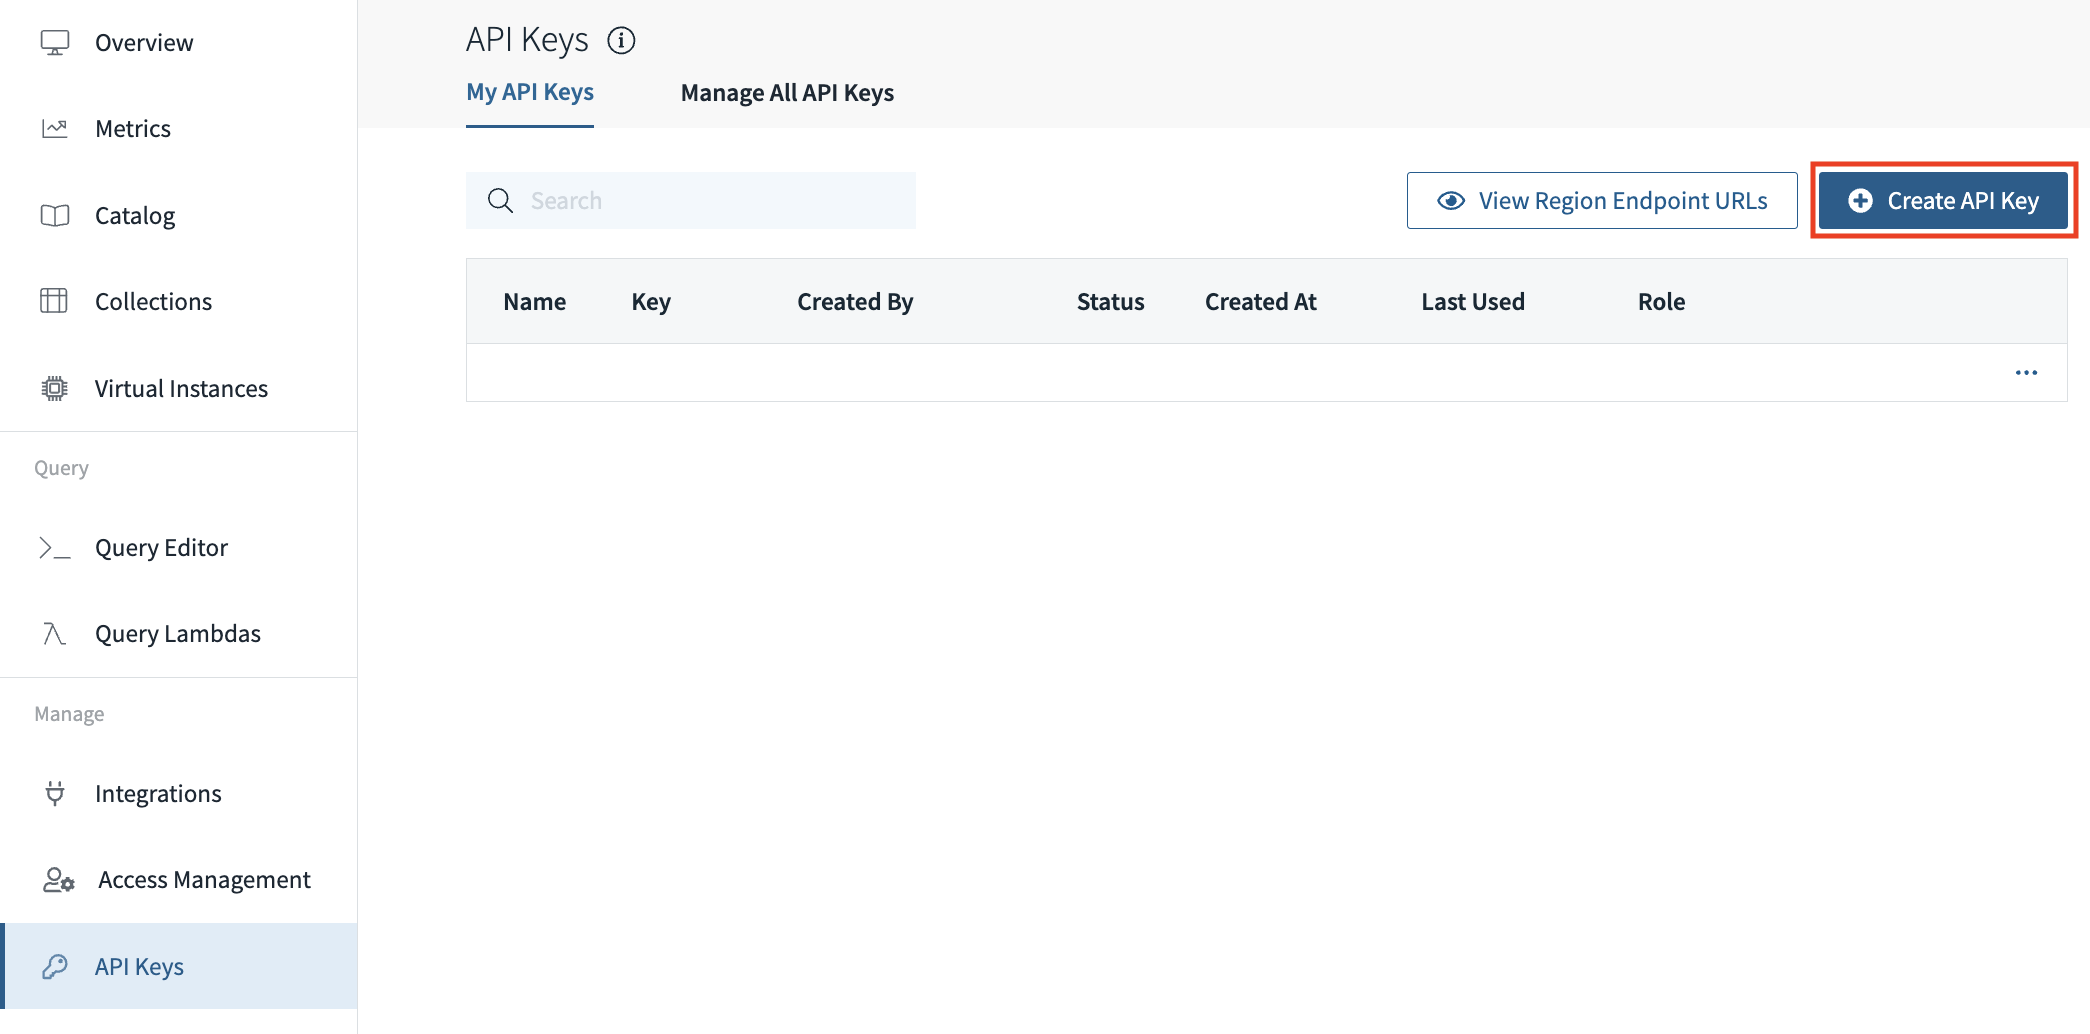
- Get credentials from Rockset. Create and save a new API Key by navigating to the API Keys tab of the Rockset Console.
-
Set up Grafana. Set up Grafana if you have not already. The Grafana website has detailed instructions here.
-
Install plugin. Use grafana cli to install your plugin. You can
download the Rockset plugin by following the instructions here. -
Add configurations for the plugin. Because this is a backend plugin, it is required that the plugin is signed; however, the Grafana team hasn't implemented this yet. Thus, in the
[plugins]section of your Grafana configuration file, you must addrockset-backend-datasourceto the list of allow_loading_unsigned_plugins. You may also set the environment variableGF_PLUGINS_ALLOW_LOADING_UNSIGNED_PLUGINSto includerockset-backend-datasourcefor the plugin to be loaded.
[plugins]
allow_loading_unsigned_plugins = "rockset-backend-datasource"
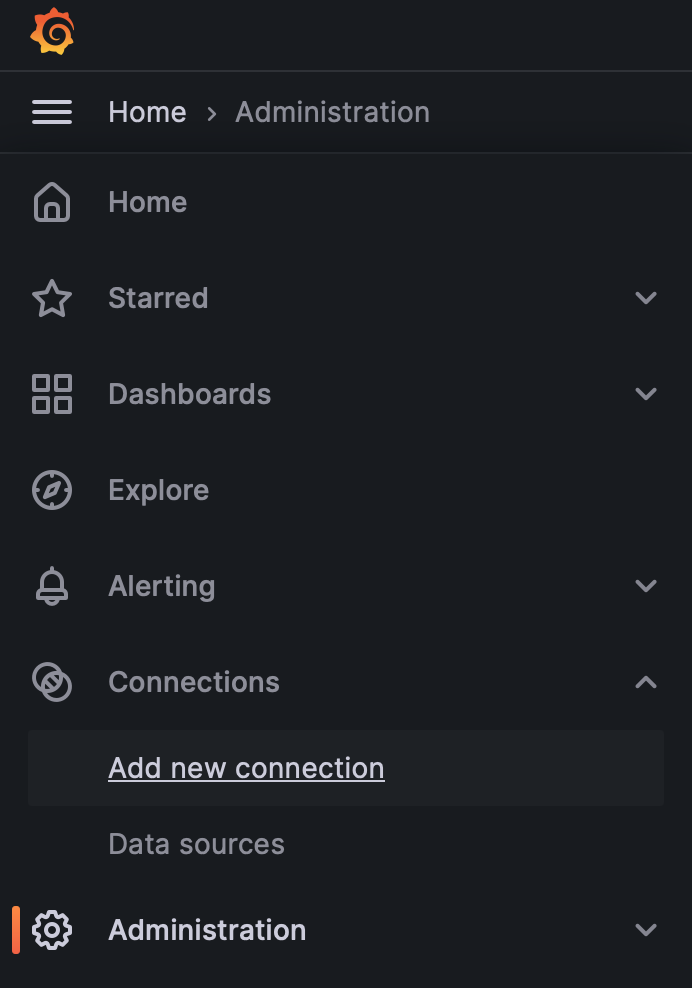
- Navigate to Connections. From your Grafana homepage, go to
/connections. You can type this in your browser, or click on the gear on the left side of the screen and click "Connections" under the configuration menu.
- Add Rockset Data Source. Type 'Rockset' into the search bar with placeholder text "Filter by name or type", and click on the Rockset data source.
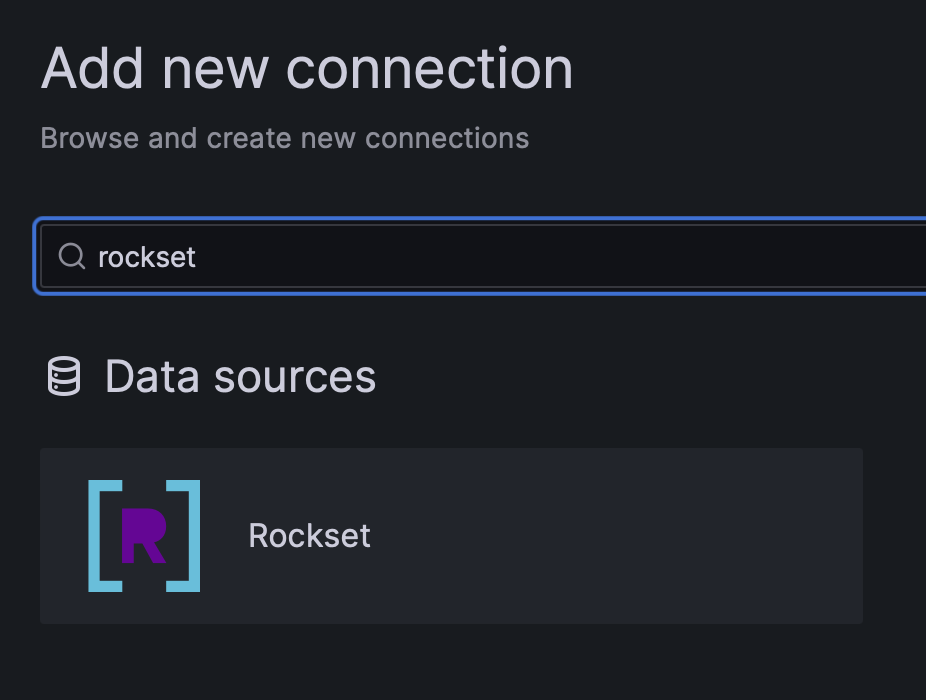
Click the "Add new data source" button.
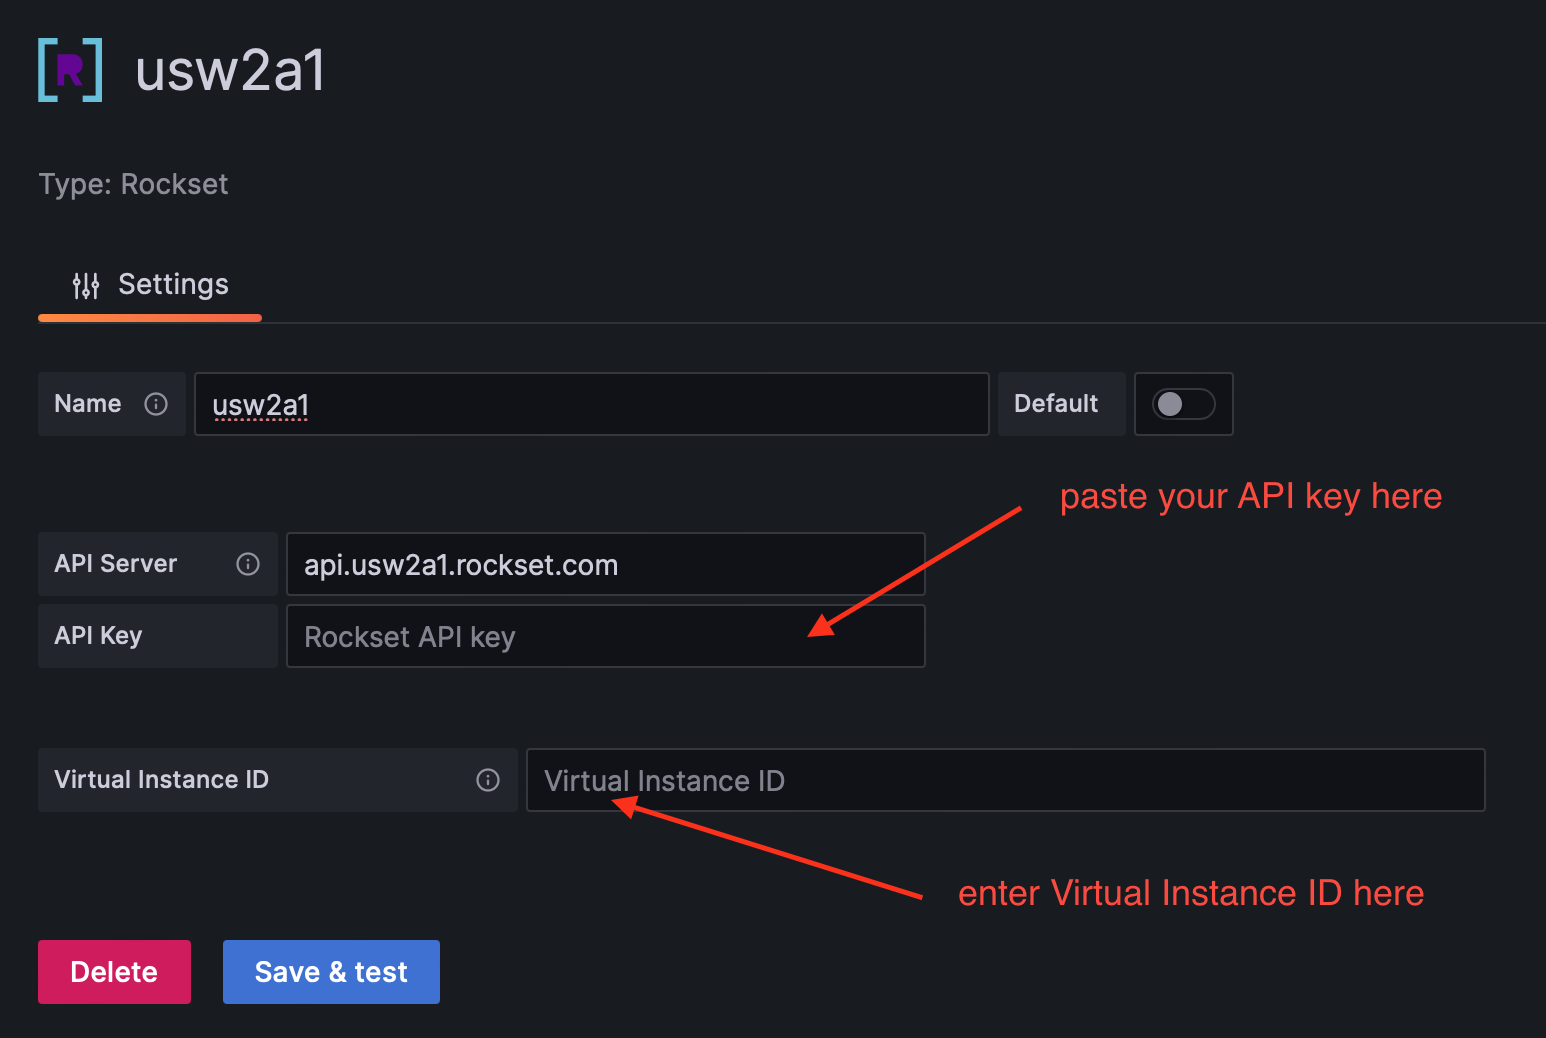
- Enter credentials. Enter your API key and name your connector, then press "Save & Test". If you get an authentication failure, ensure your API key was pasted correctly. If you want the queries to execute on a specific virtual instance, enter the ID, or leave it blank to use the default virtual instance.
Usage
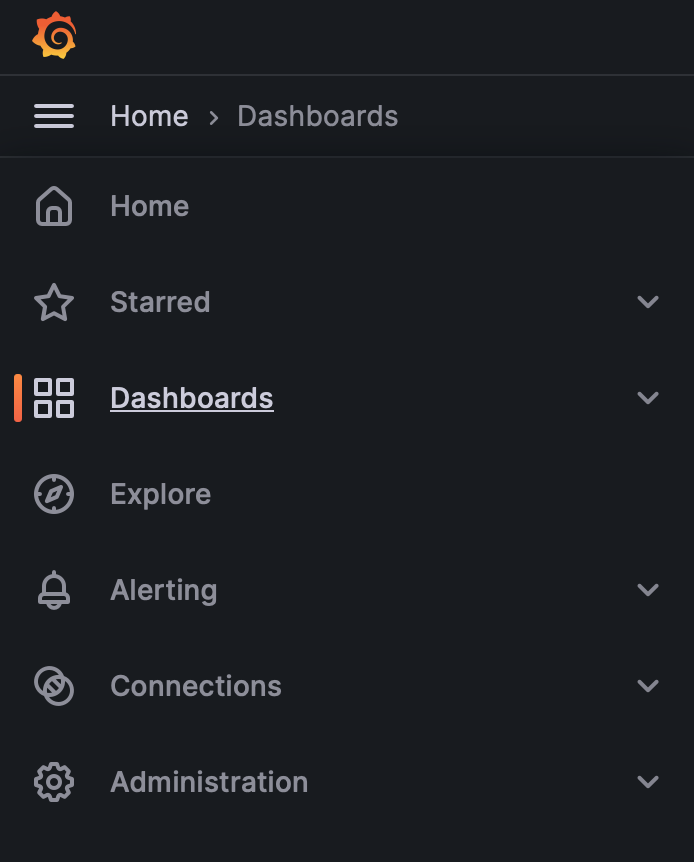
- Navigate to dashboard. Click on the plus on the left side of the screen, and click on "Dashboards".
-
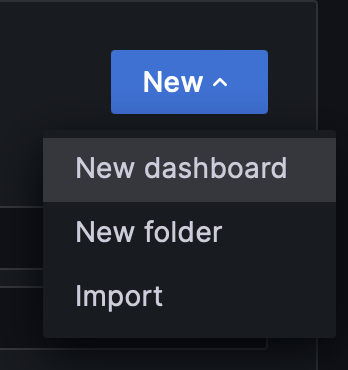
Add a new dashboard Click on "New dashboard".
-
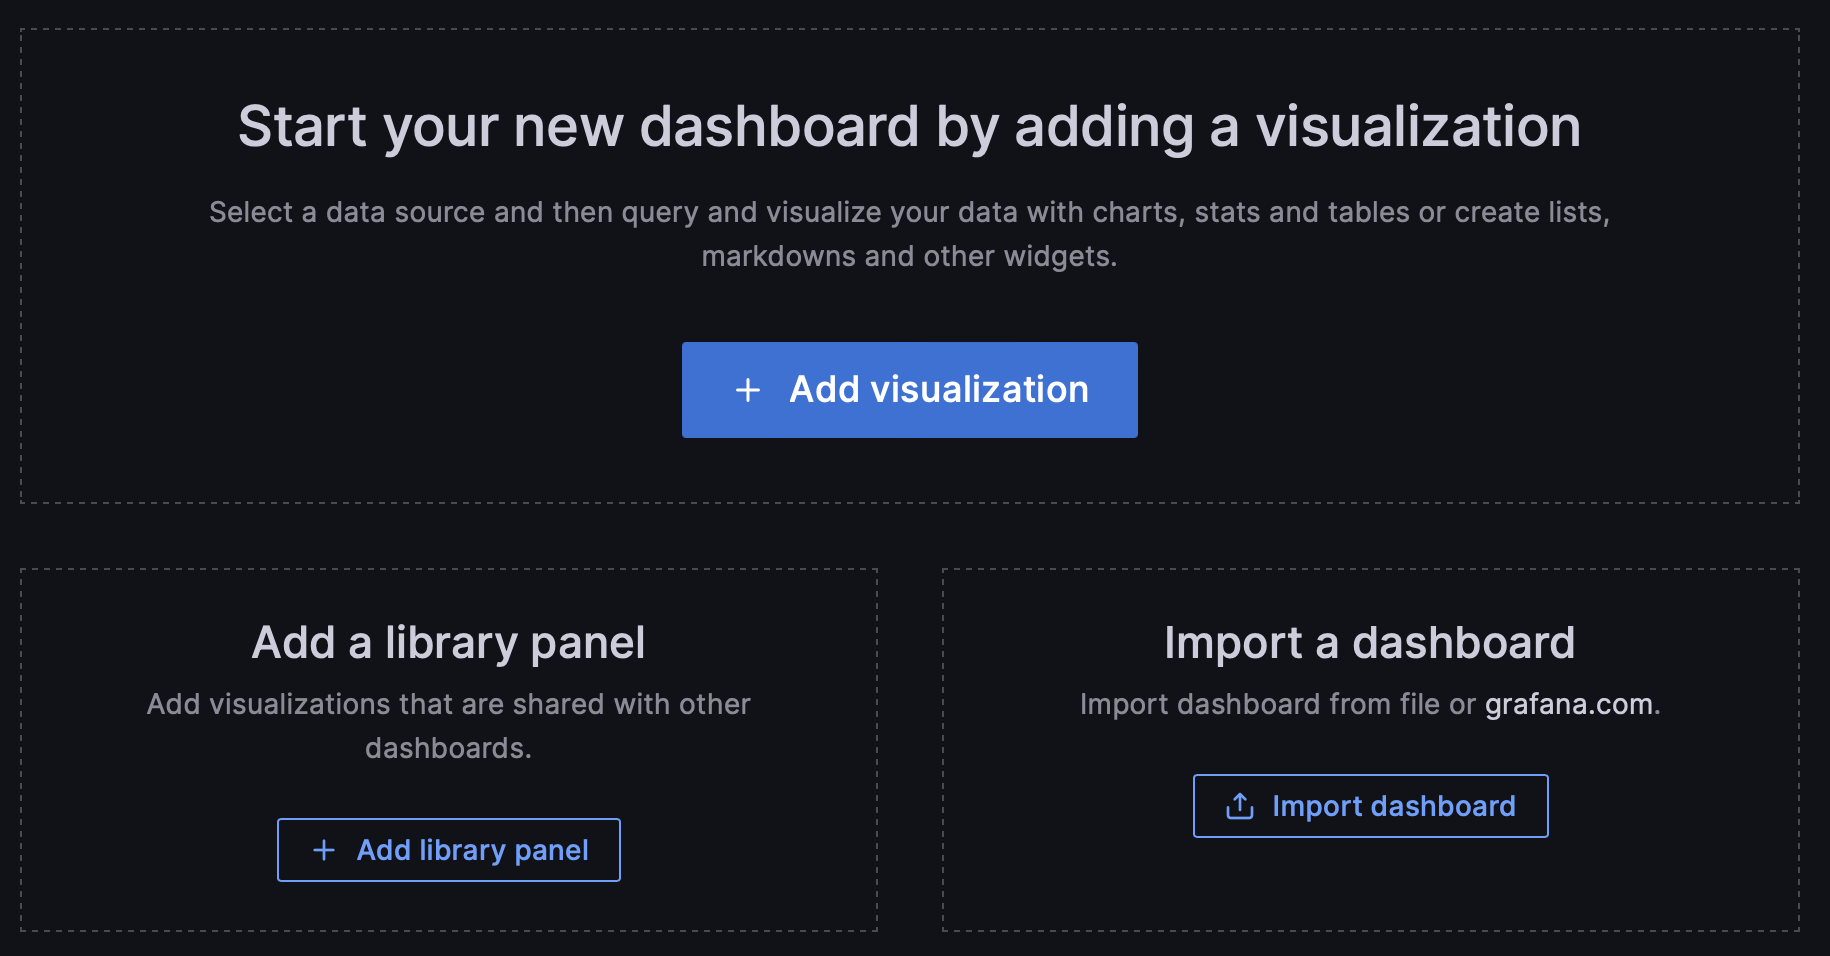
Add a new visualization. Click on "Add visualization" in the new dashboard.
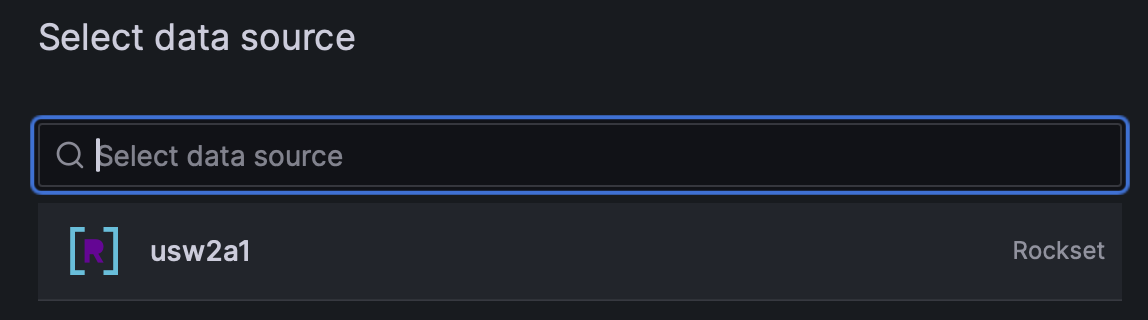
- Select Rockset data source. Select your Rockset data source from the list.
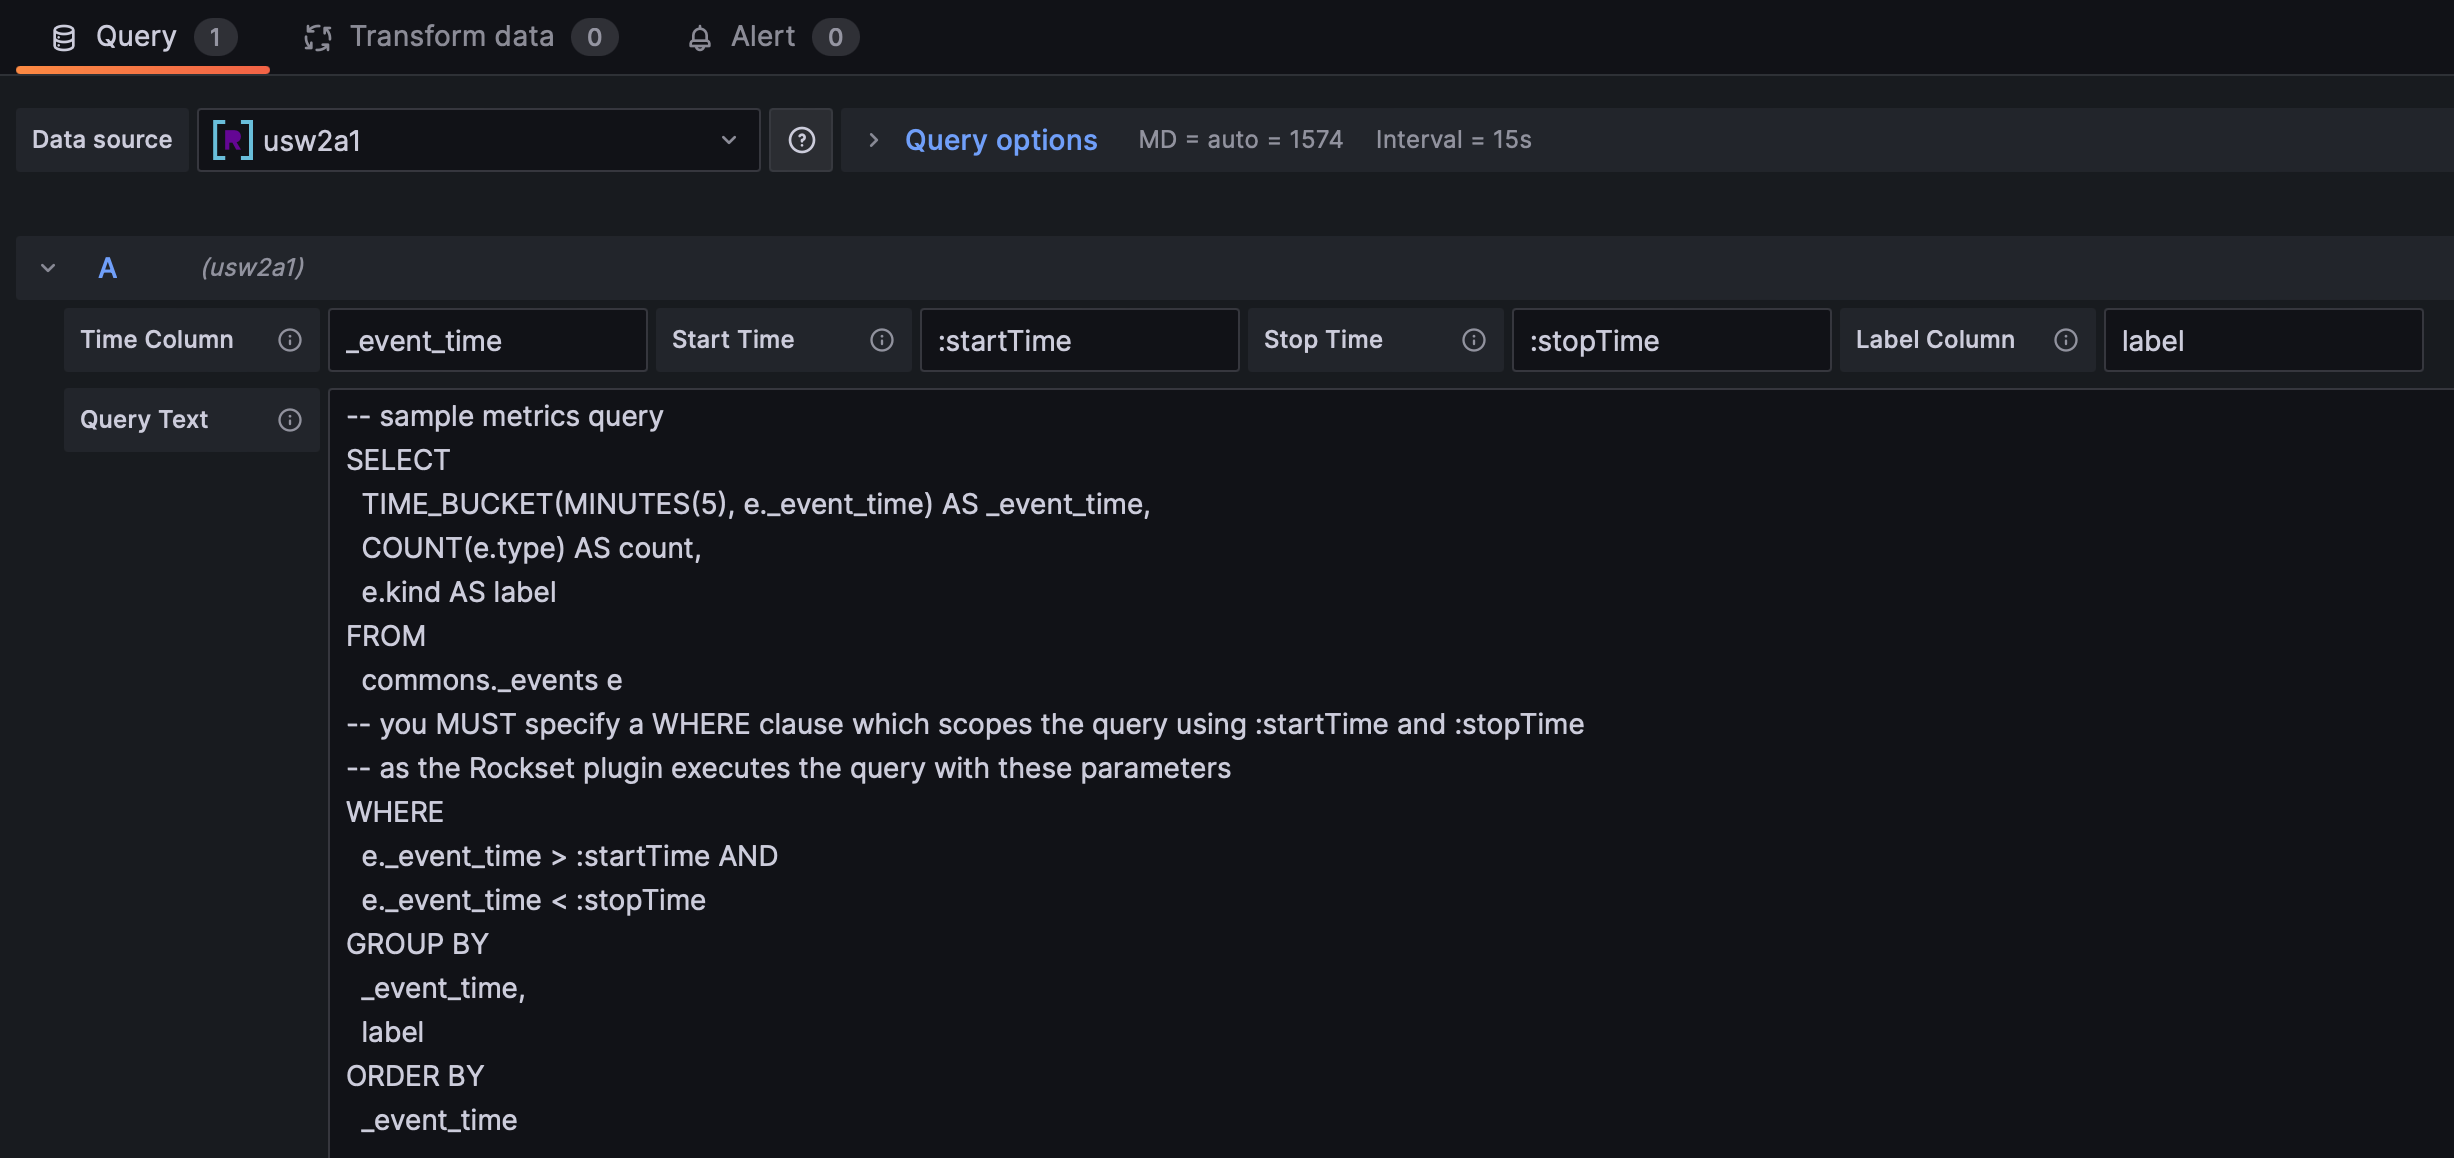
- Enter query. Enter your Rockset query into the text field. This query can be any SQL statement that is valid in the Rockset Console, but if you are using a graph visualization, you need a timeseries field. The plugin comes with a default query which shows the events from the
_eventscollections.
-
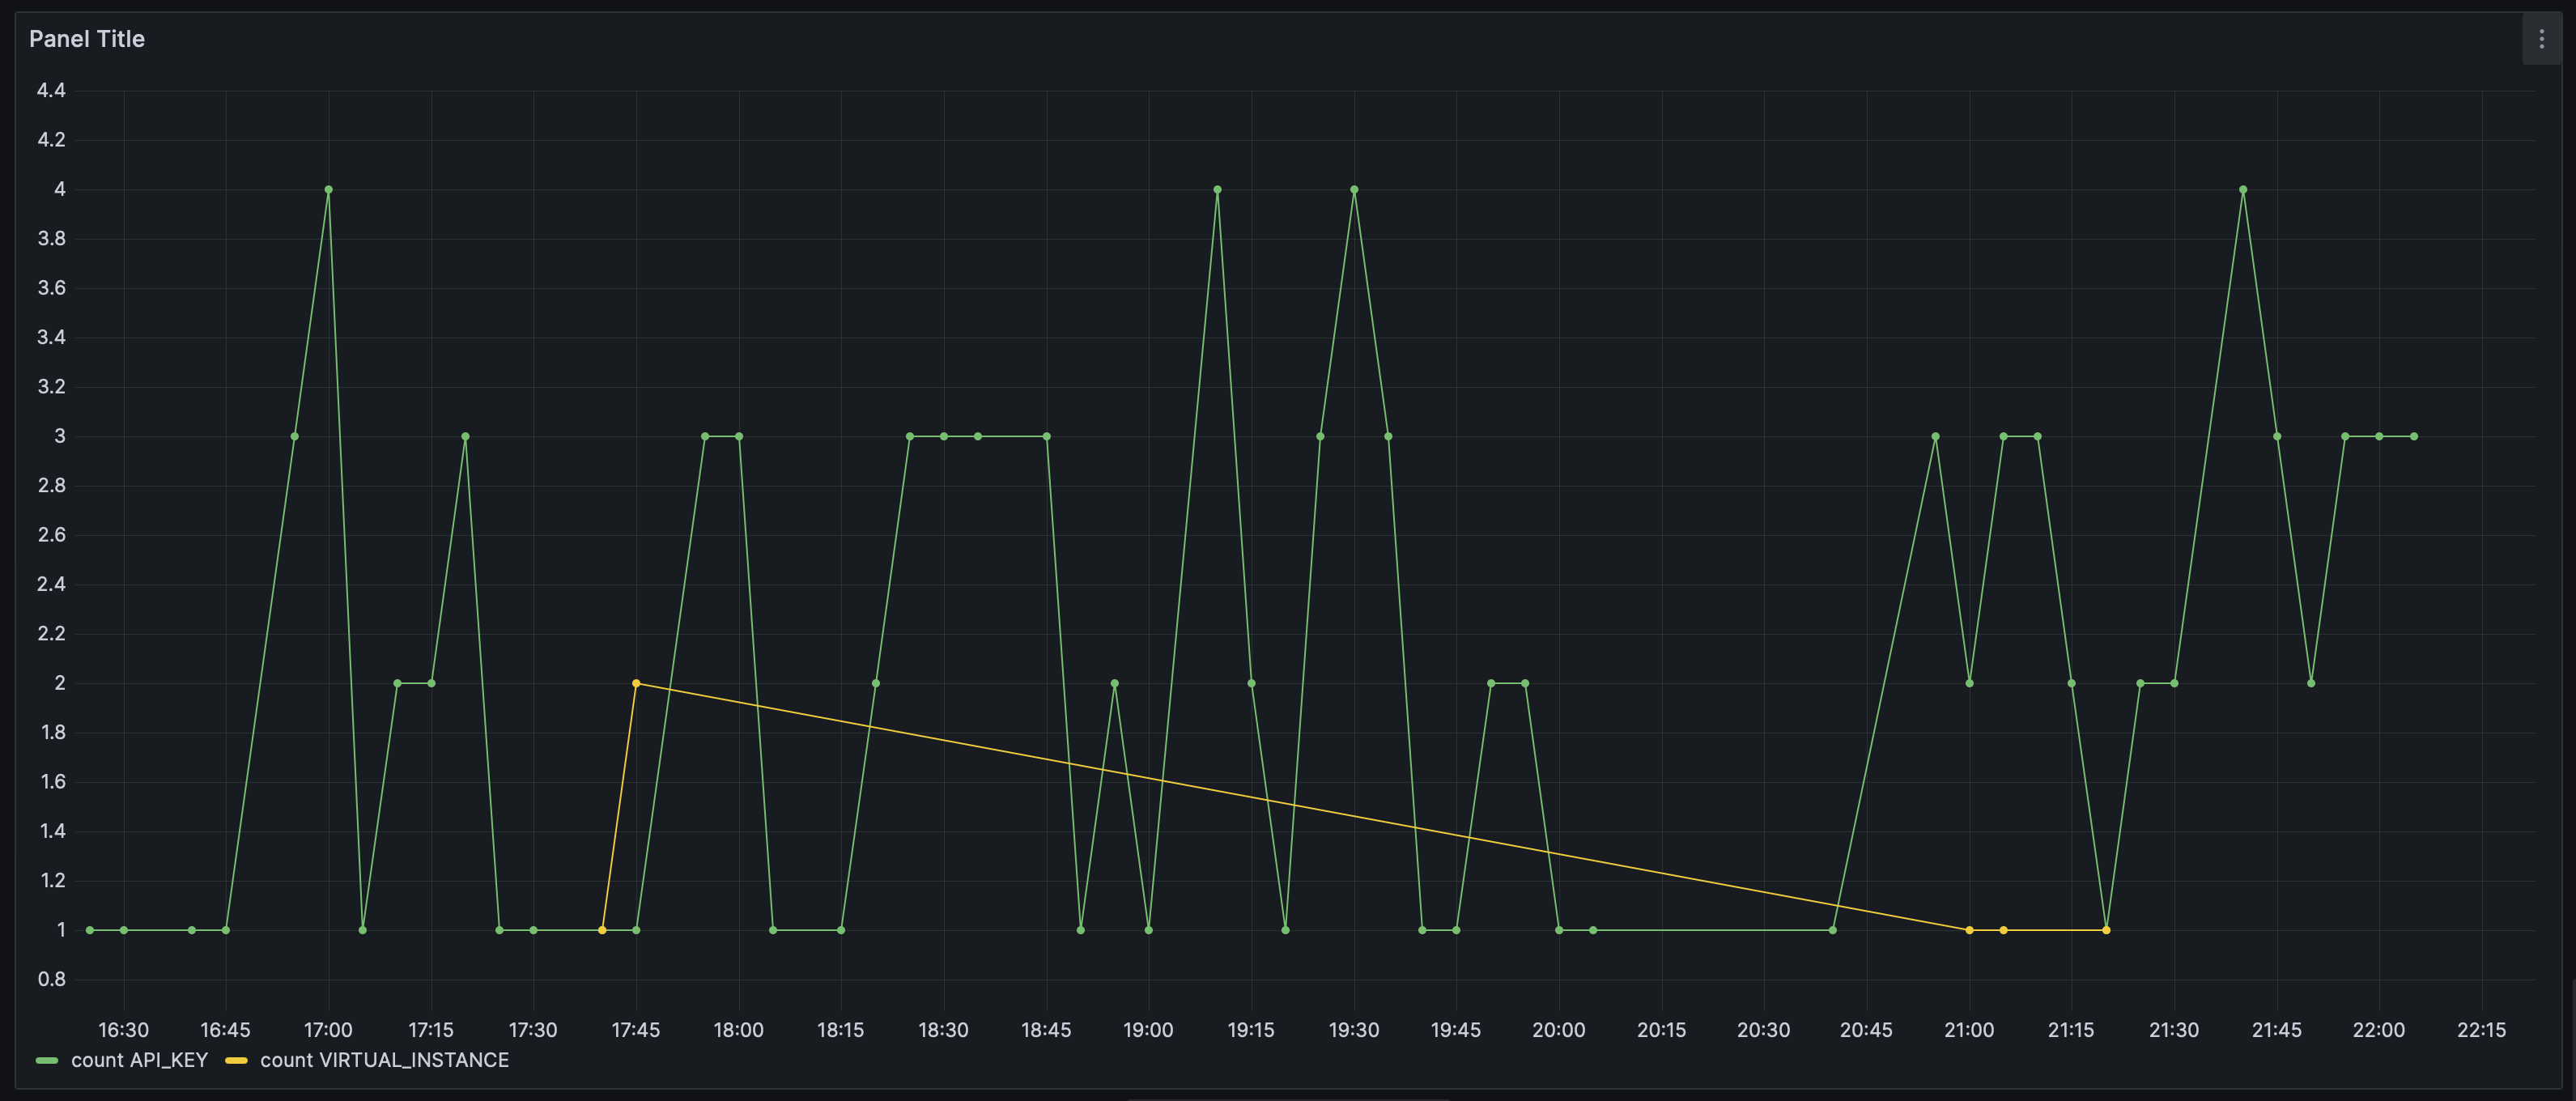
(Optional) Select visualization. Choose a visualization from the visualization tab on the left of the screen to format your data in different ways.
-
View results. You should now be able to see your results and save your panel!
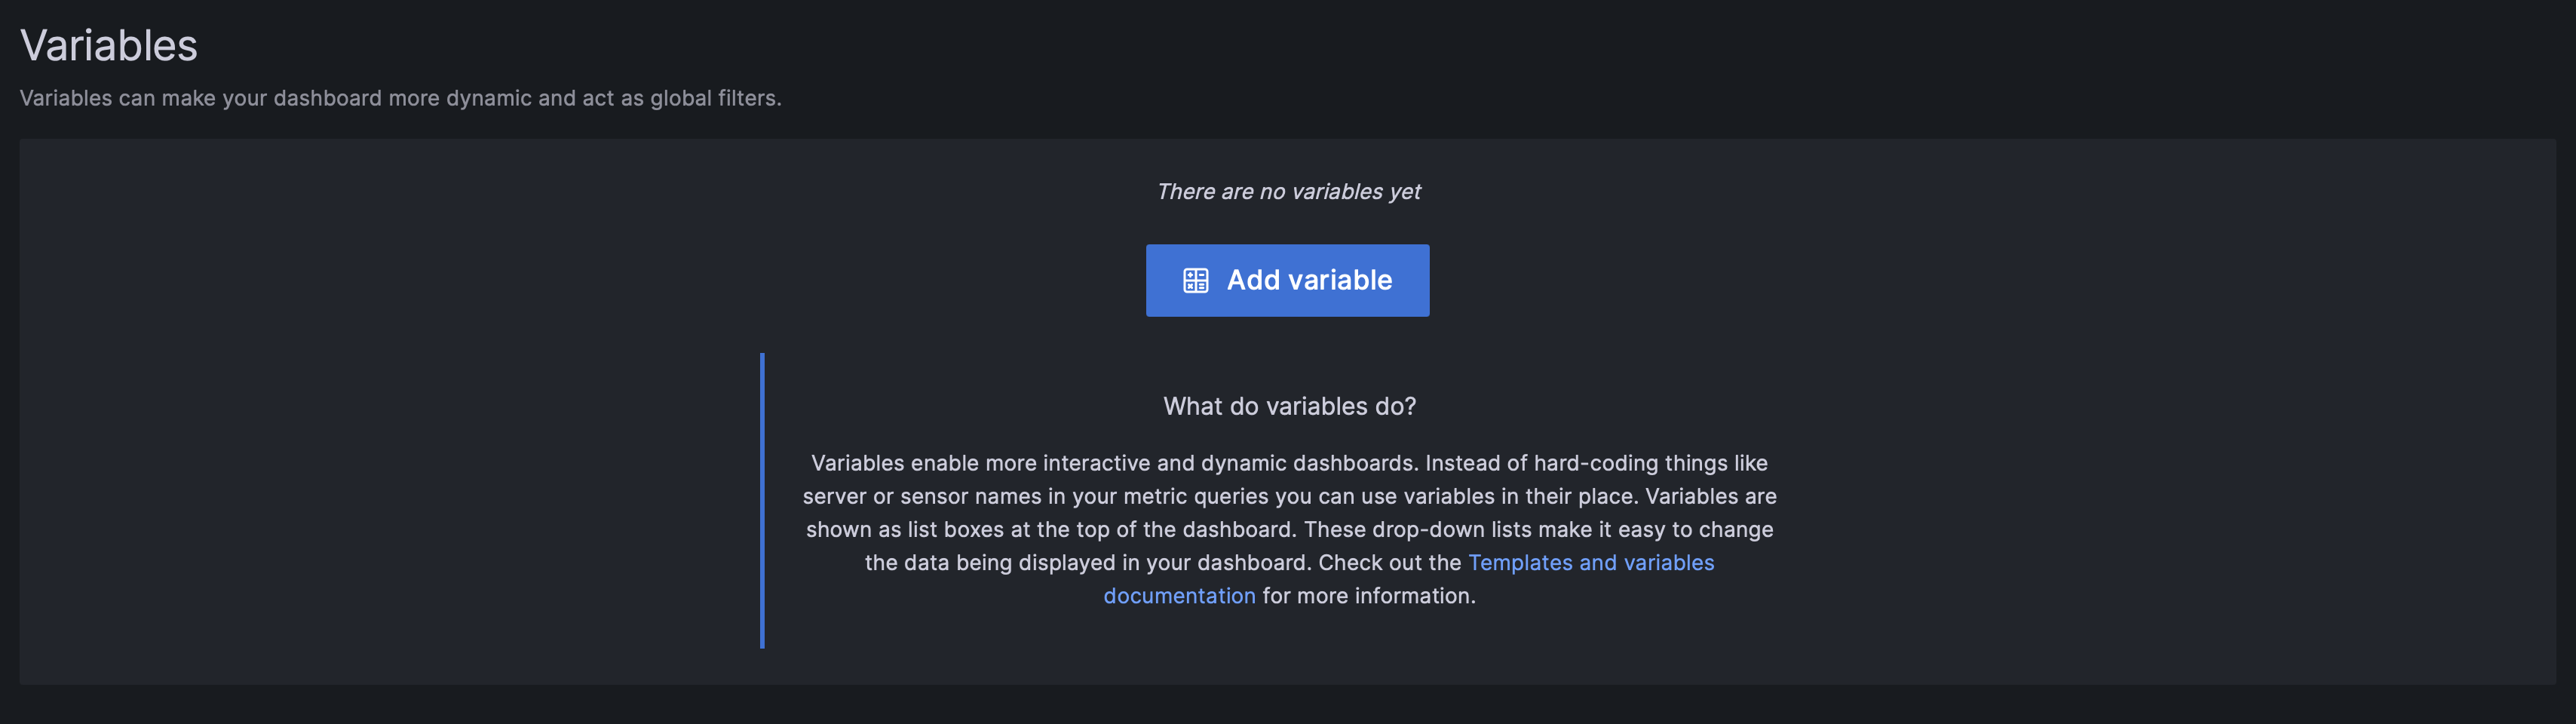
Variables
The Rockset plugin allow you to extract variables using a SQL query.
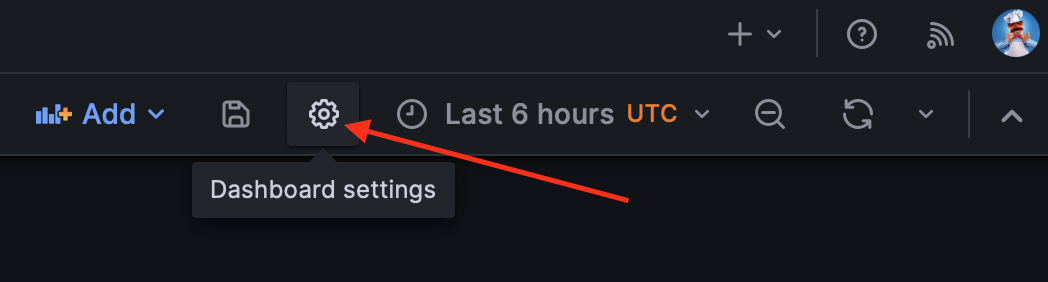
-
Dashboard settings. Click the "Dashboard settings" in the upper left of the dashboard.
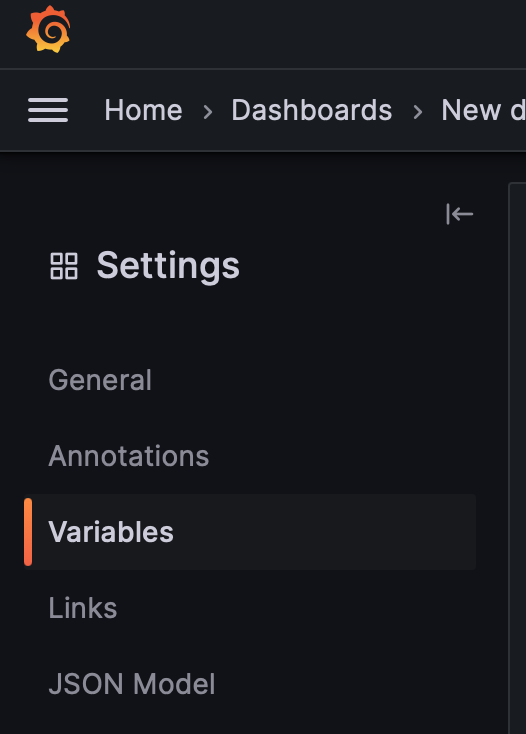
-
Variables Click the "Variables" section in the drop down menu.
-
Add a new variable Click "Add variable"
-
Enter query
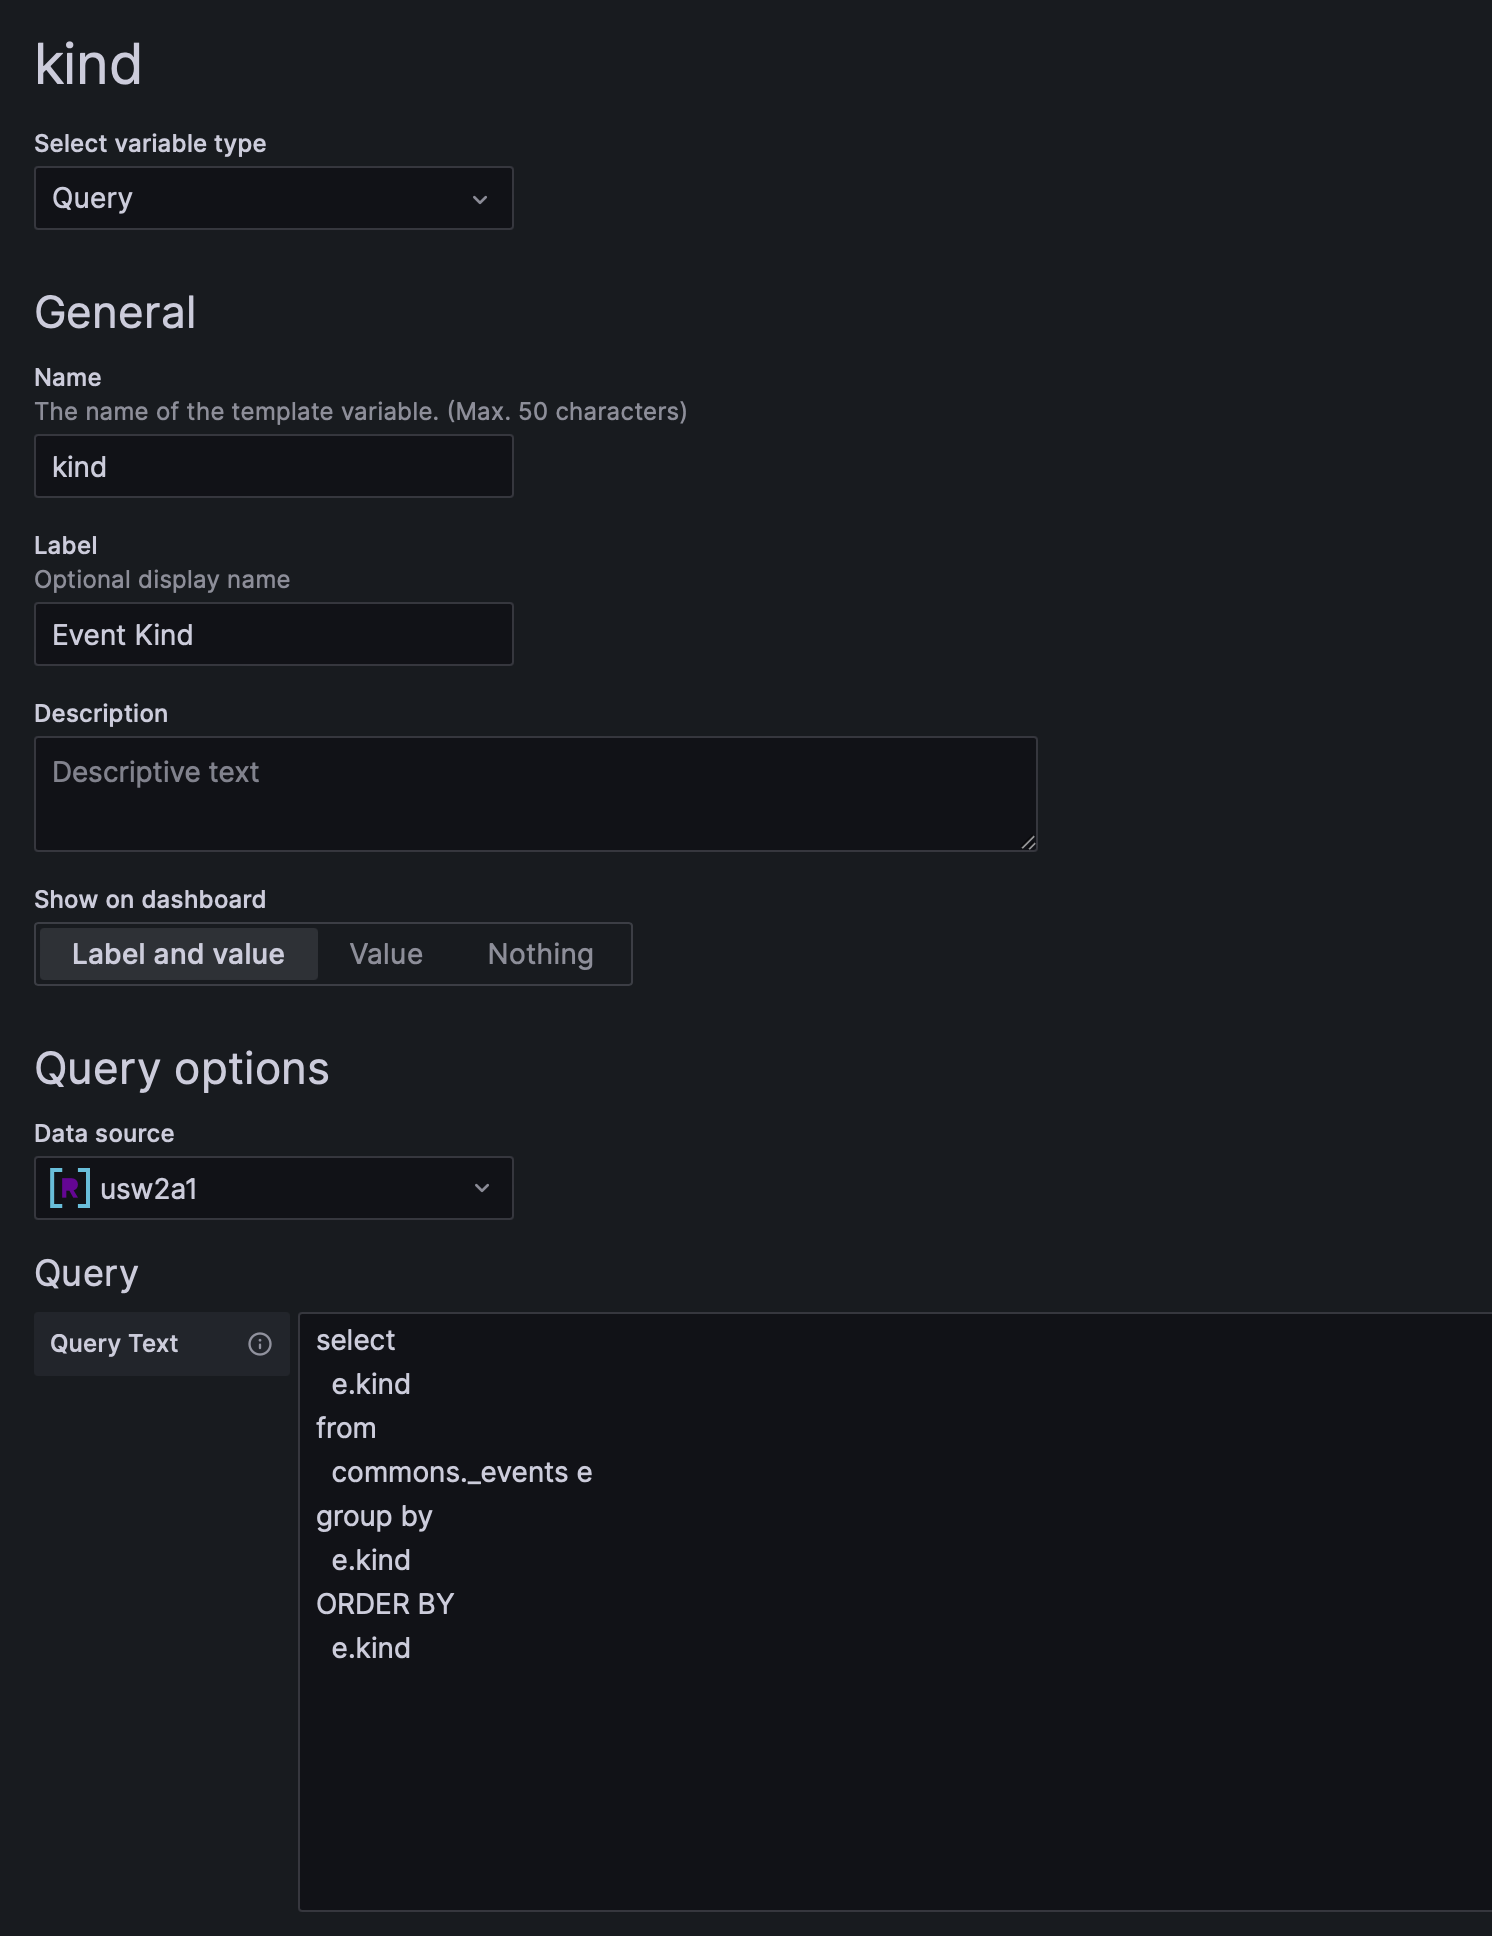
-
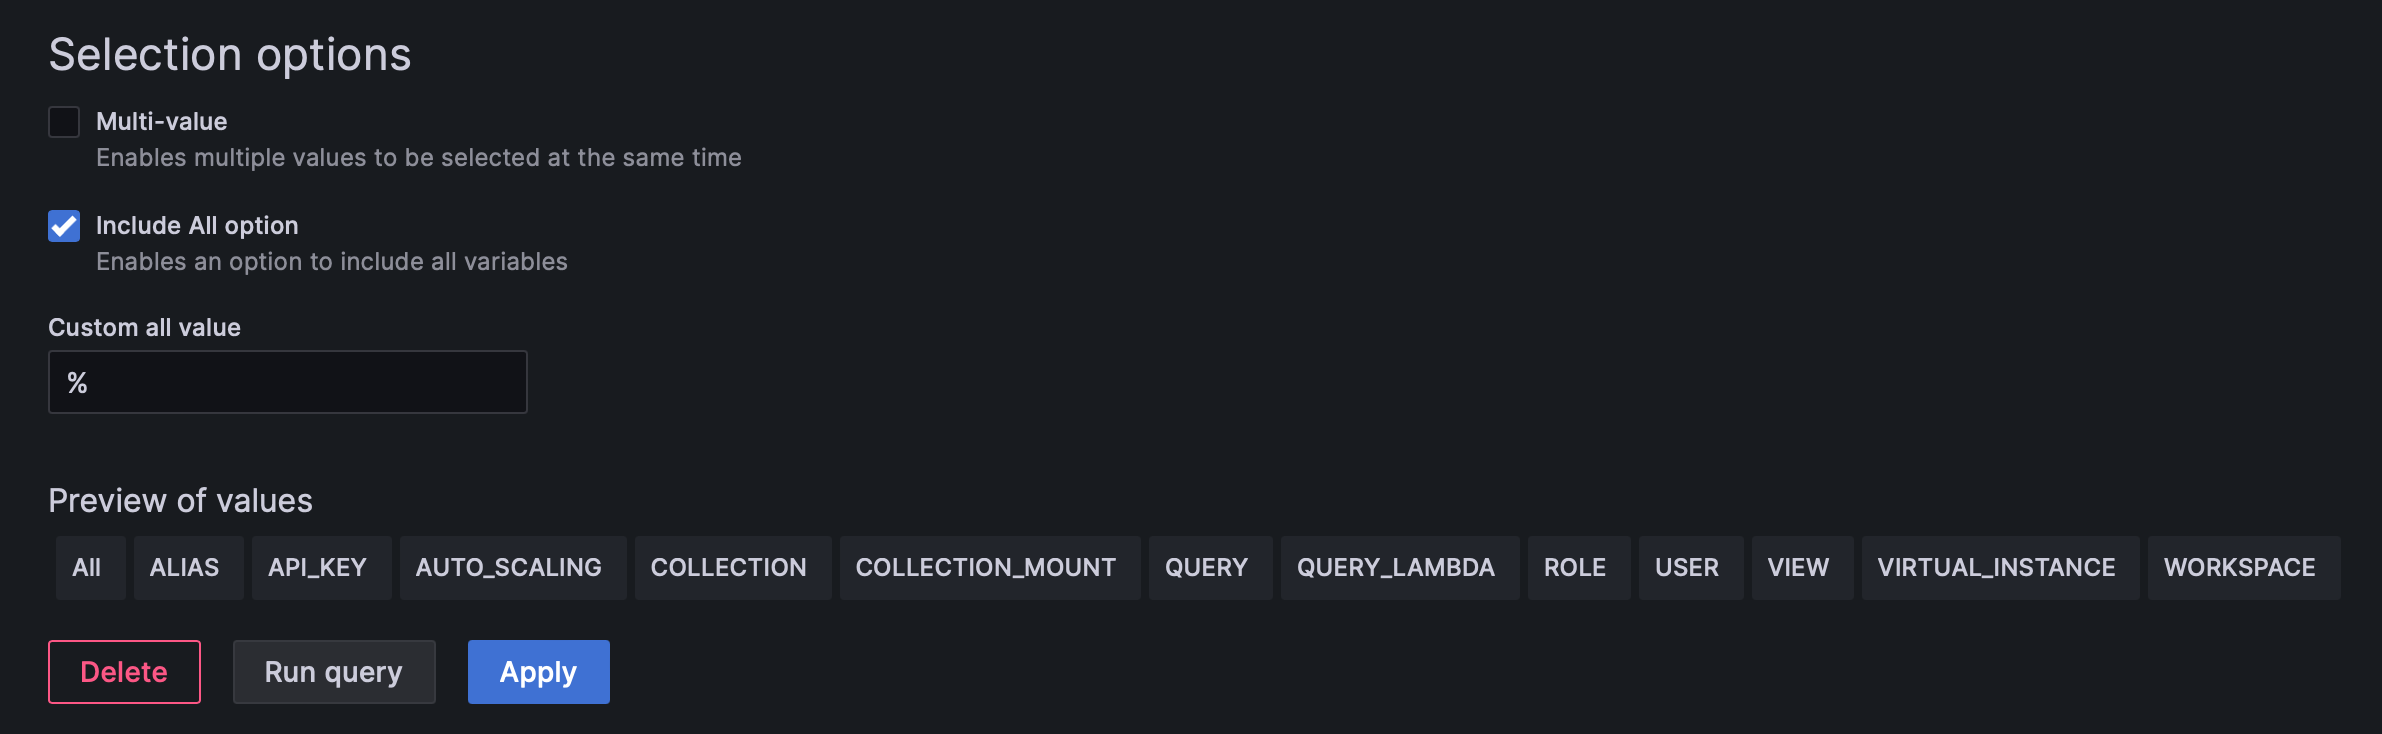
(optional) Add an ALL option If you want to be able to show all values, select "Include All option" and enter
%
-
Apply Click the "Apply" button.
-
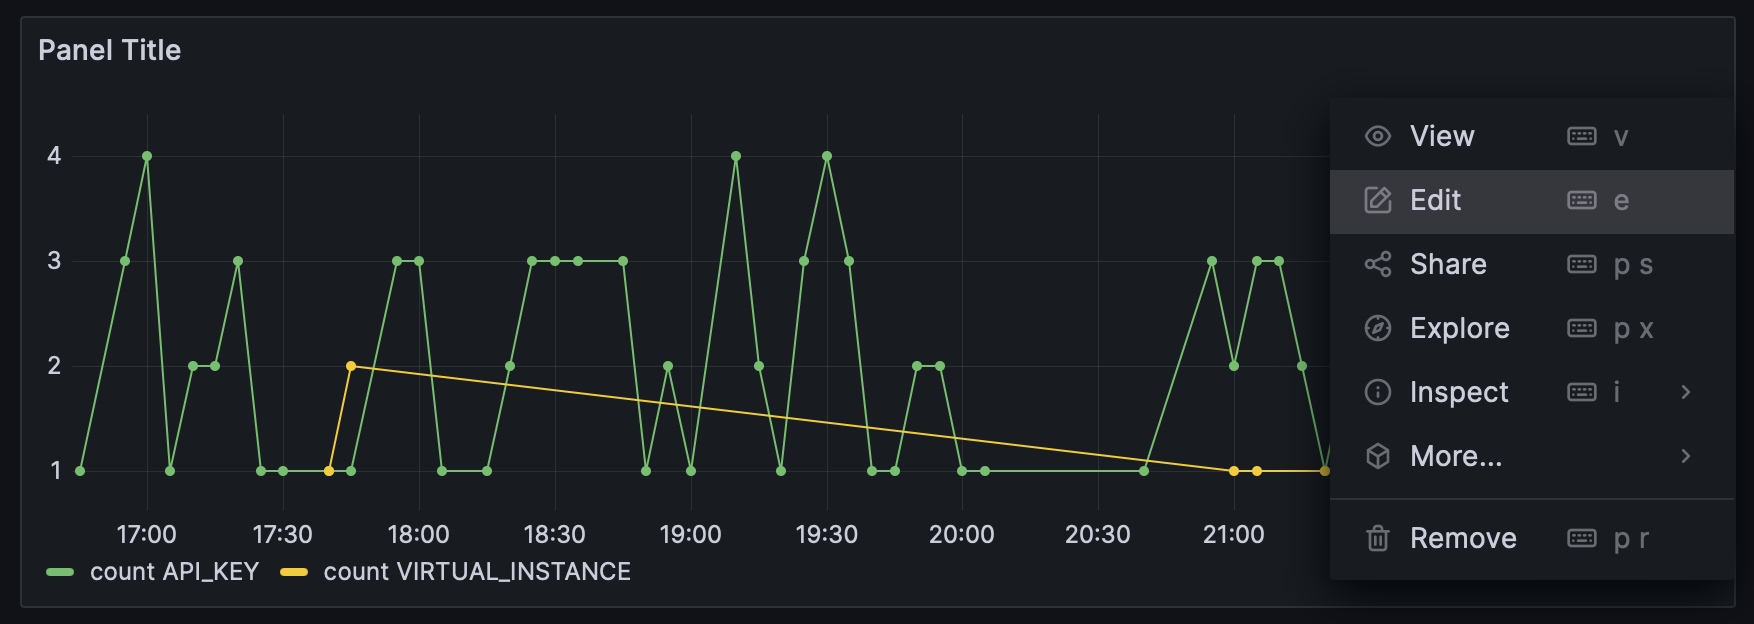
Open your panel Go back to your dashboard, and select "edit" on the panel
-
Edit the SQL query Add to the
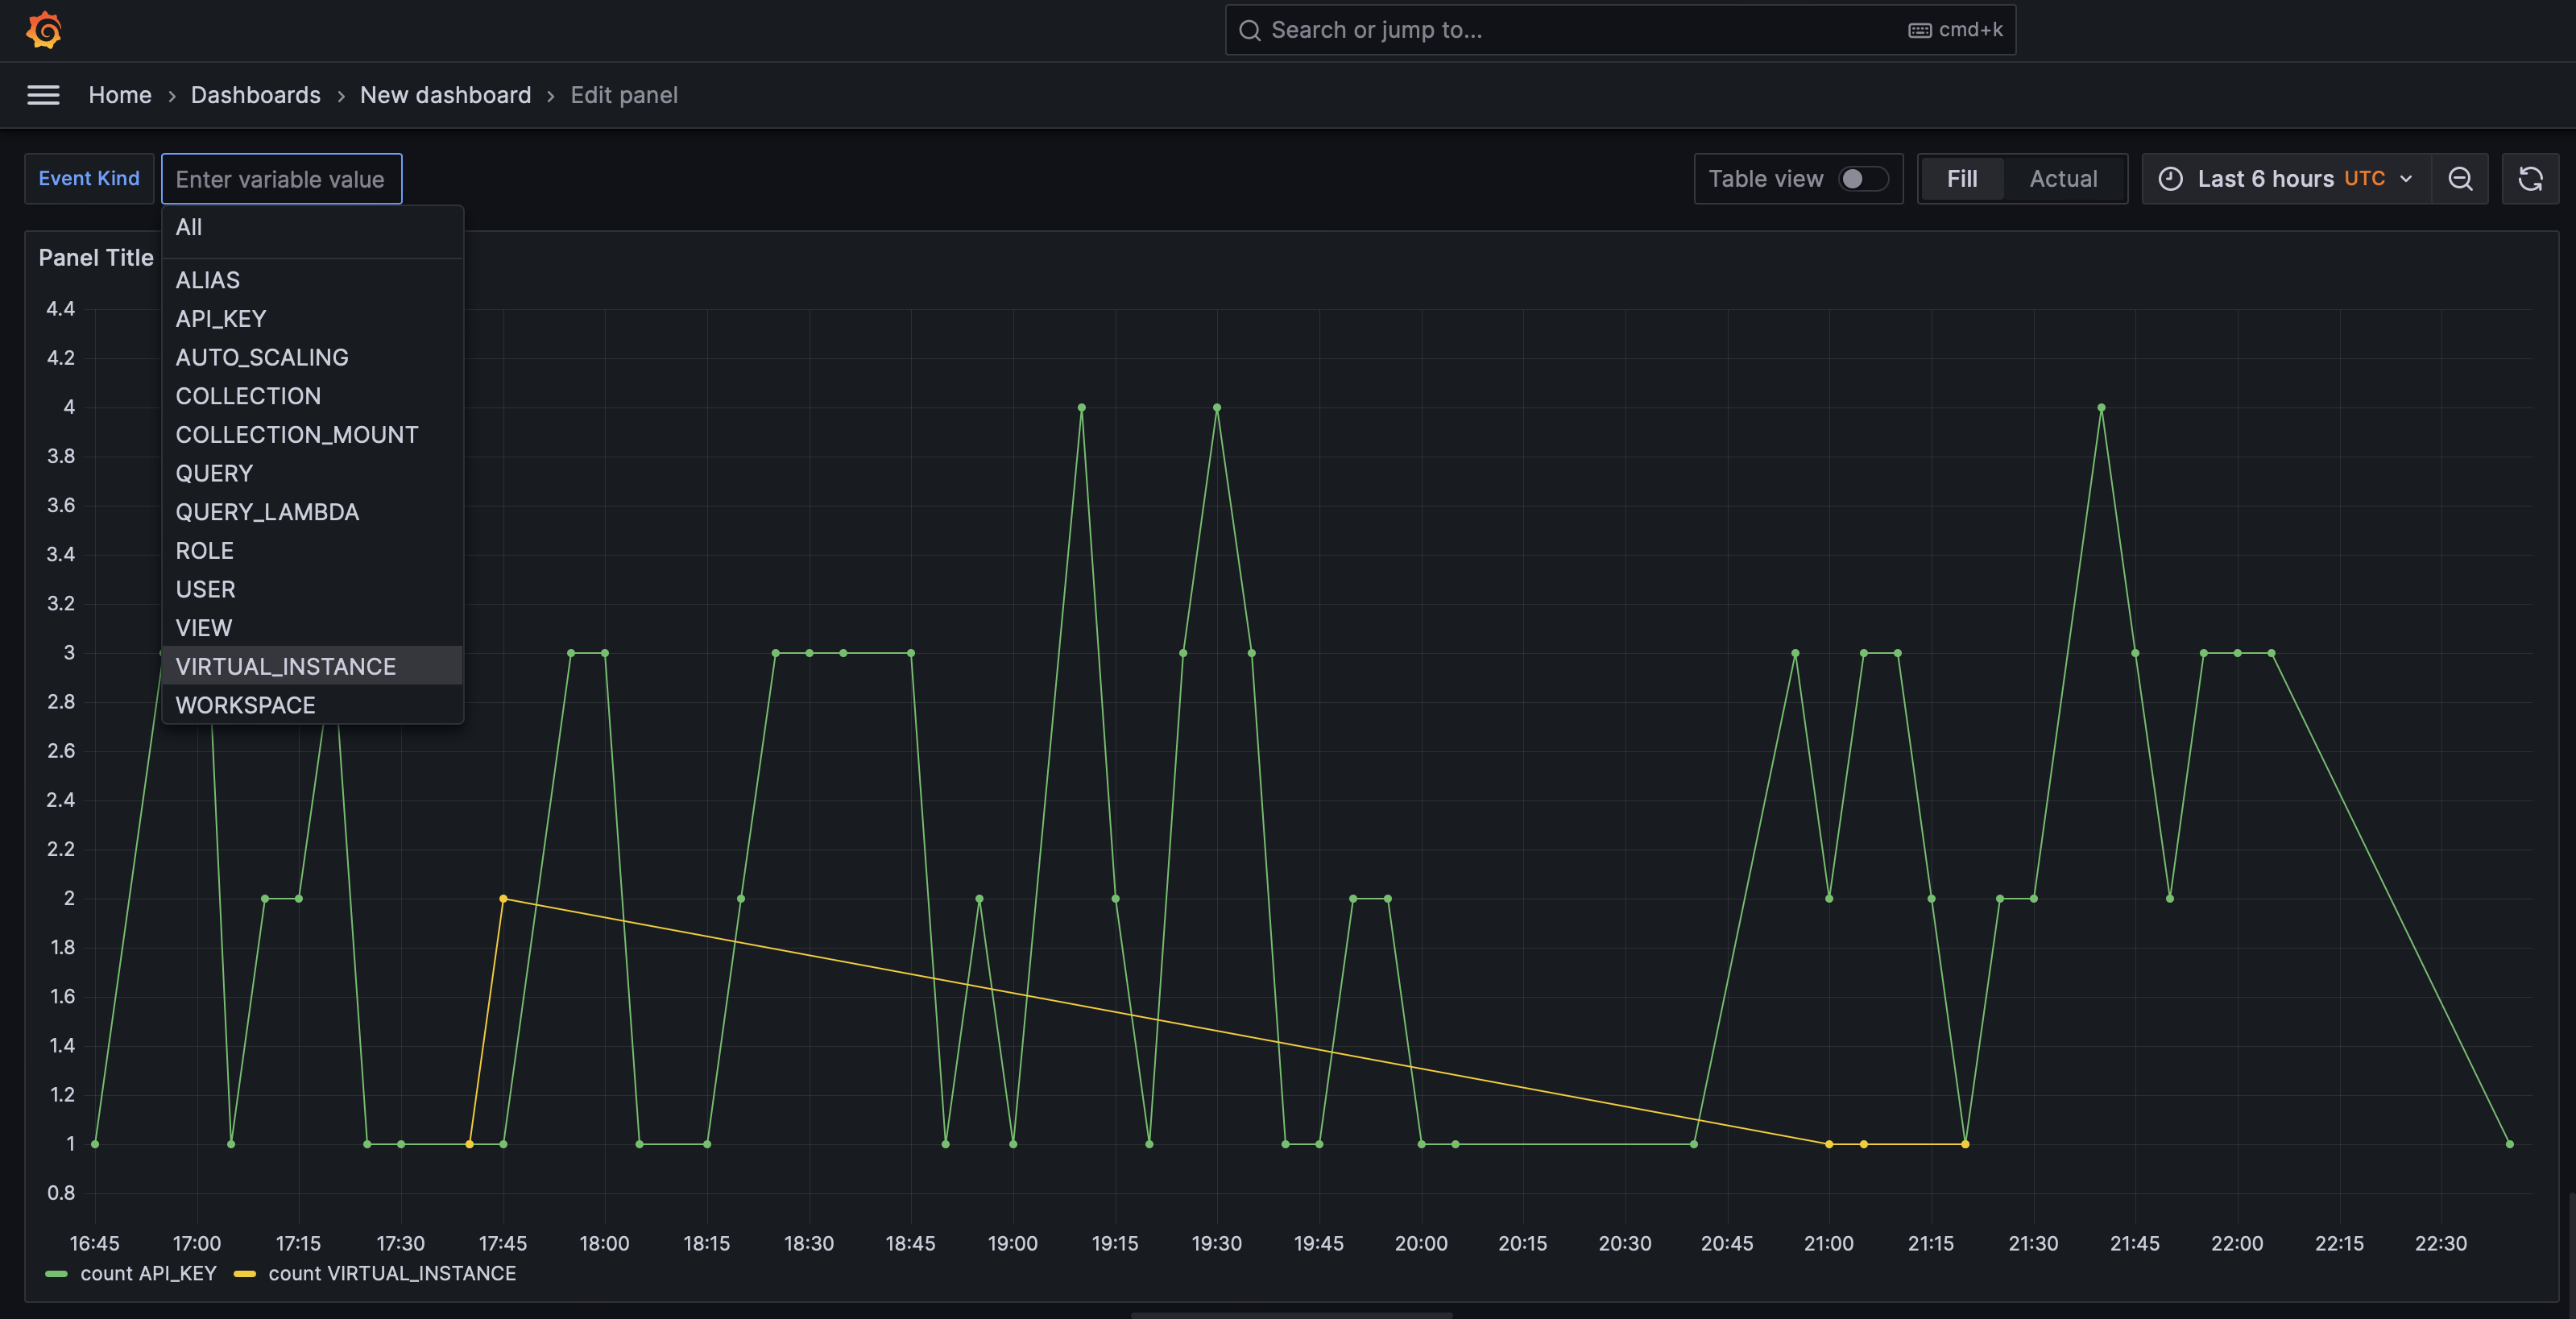
WHEREclause so it becomes. The$kindwill be replaced with the variable before the SQL is executed.WHERE e._event_time > :startTime AND e._event_time < :stopTime AND e.kind LIKE '$kind' -
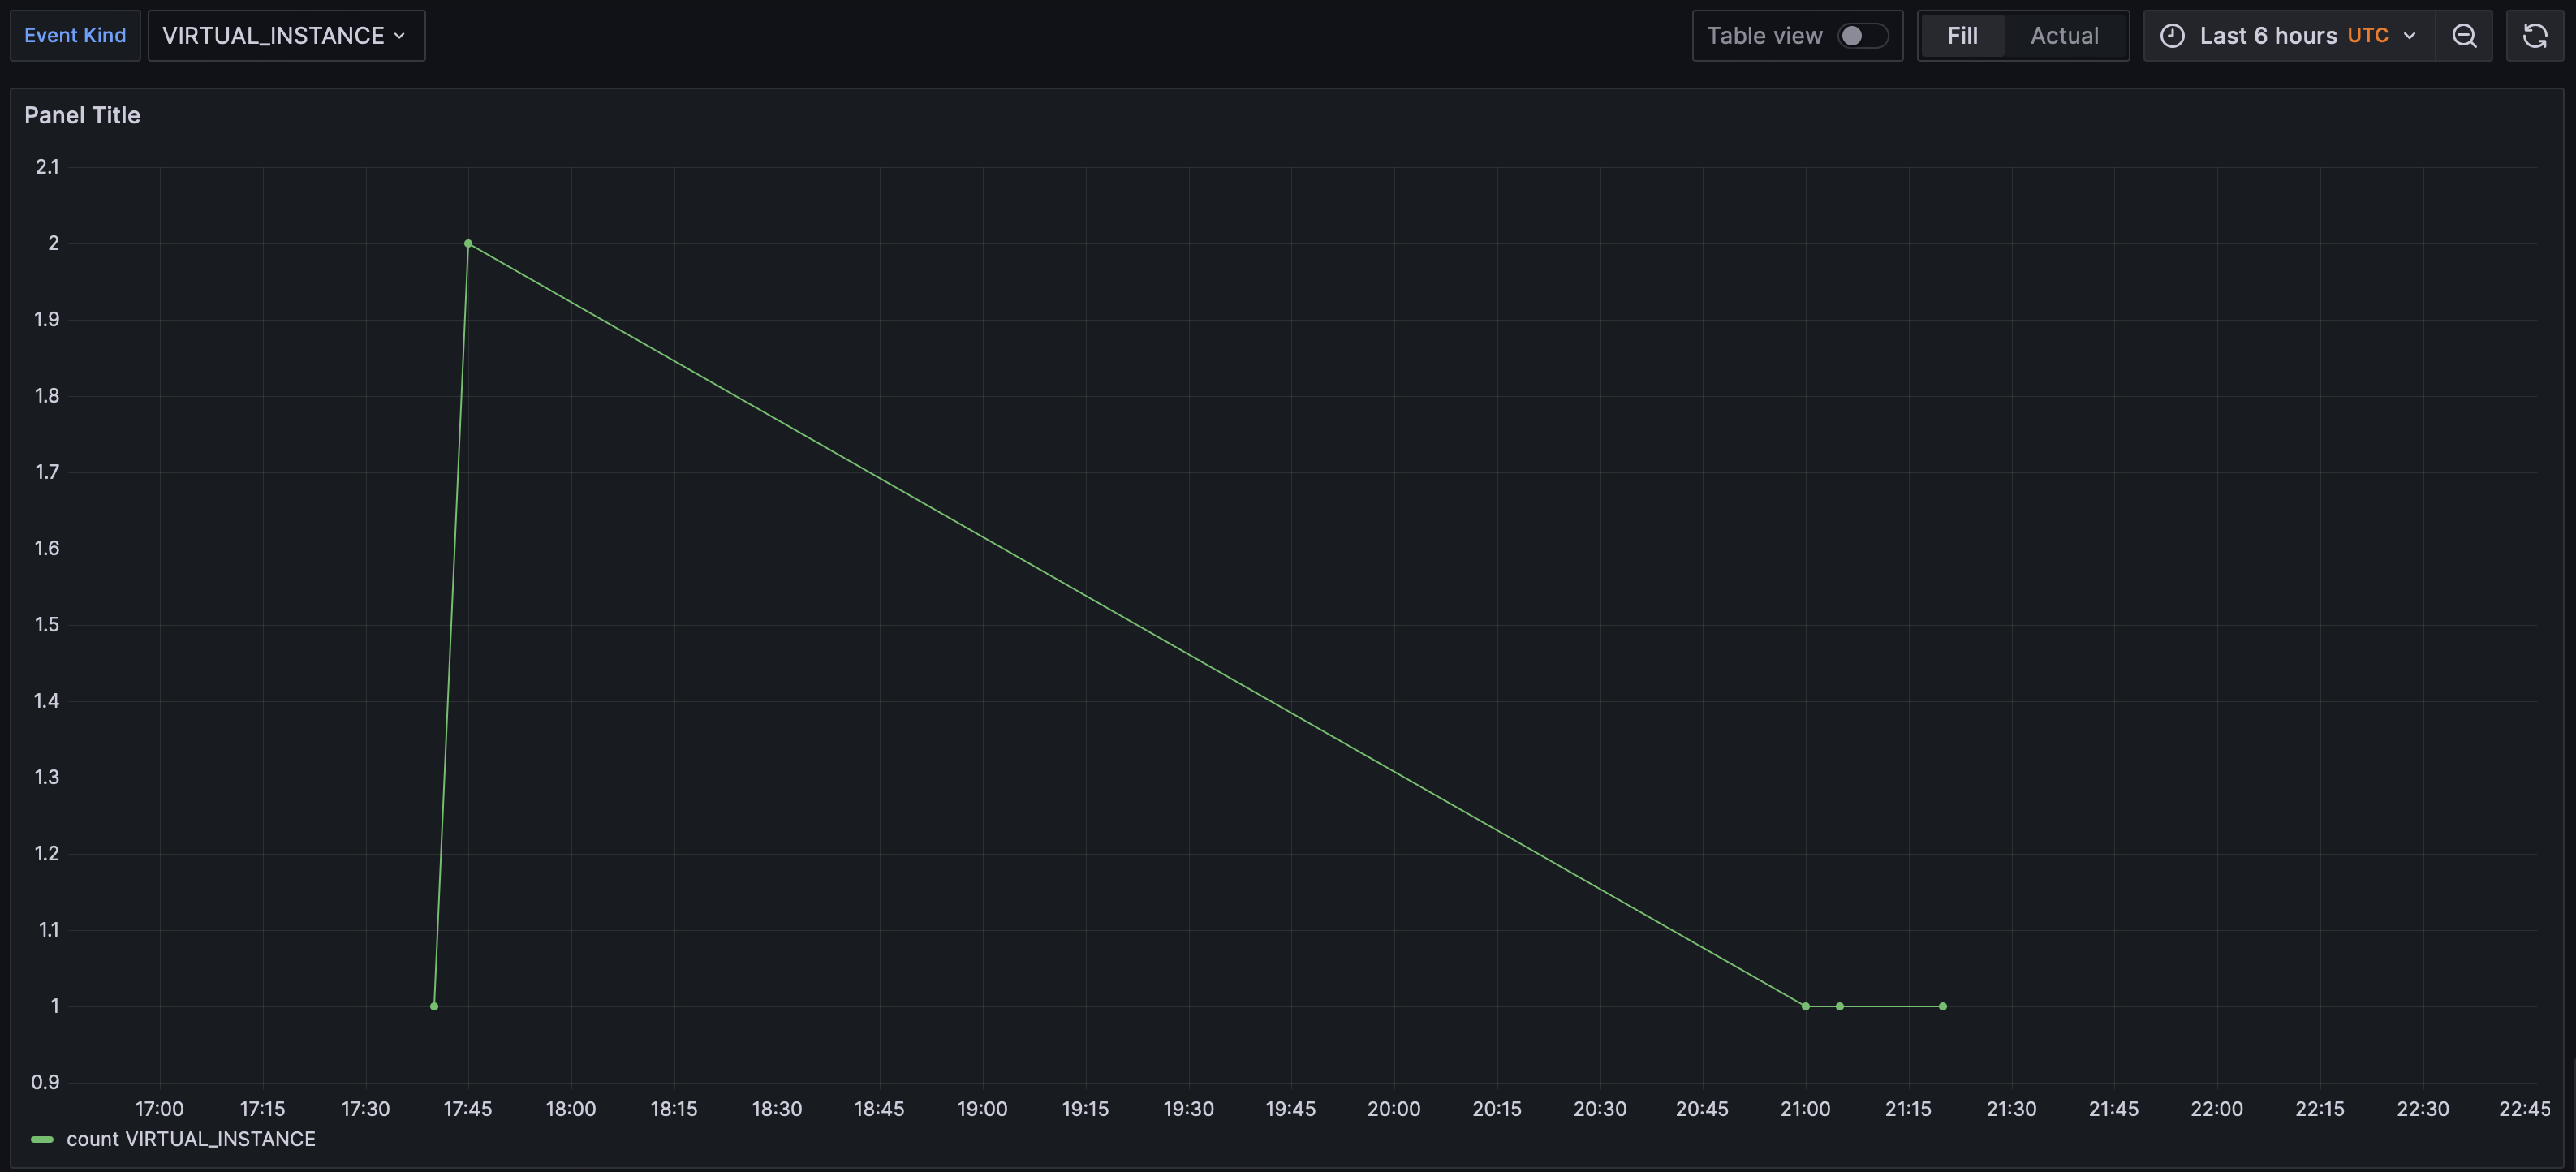
Select an event kind From the drop down menu, select one option
- Filtered view You now have a filtered view
Updated about 1 year ago