
Logs
This page describes how Rockset provides visibility into your account through the notion of events – which are stored as documents in a special Collection called _events. It also describes how you can create collections that ingest and store logs of queries that you run.
Audit Logs
Audit records are captured within the _events collection. With the Standard edition of Rockset, the _events collection has a retention of 30 days for actions in the platform, excluding query/write logs. With Premium, the retention is 1 year with the ability to export all audit logs, and includes query/request logs. For access to older event logs, please contact Rockset Support.
The _events Collection
_events CollectionThe _events collection is created when your organization is initialized and cannot be deleted. All events exist in the _events collection as documents containing the following fields:
_id: a unique event identifier_event_time: the time at which the event occurred, in milliseconds after January 1, 1970 (UTC)label: one of the labels listed in the table belowkind: can beAPI_KEY,COLLECTION,INGEST,INTEGRATION,ORGANIZATION,QUERY, orUSER.Note on
QUERYkindEvents in the
QUERYcategory only apply to queries made from the Rockset Console, and does not include events from queries made via API calls.type: can beINFO,WARNING,ERROR, orDEBUG
Events may also have additional fields depending on the specific event. All supported events are listed in the table below, as well as additional fields for each event label:
| Label | Kind | Type | Additional Fields |
|---|---|---|---|
| API_KEY_CREATED | API_KEY | INFO | api_key_name , user_email , details |
| API_KEY_DELETED | API_KEY | INFO | api_key_name , user_email , details |
| API_KEY_ERROR | API_KEY | ERROR | api_key_name , user_email |
| COLLECTION_CREATED | COLLECTION | INFO | collections , user_email |
| COLLECTION_DROPPED | COLLECTION | INFO | collections , user_email |
| INGEST_WARNING | INGEST | WARNING | collections , details |
| INGEST_ERROR | INGEST | ERROR | collections , details |
| INGEST_INFO | INGEST | INFO | collections , details |
| INGEST_INITIALIZED | INGEST | INFO | collections |
| INTEGRATION_CREATED | INTEGRATION | INFO | integrations , user_email |
| QUERY_COLLECTION_NOT_READY | QUERY | ERROR | user_email , details |
| QUERY_ERROR | QUERY | ERROR | user_email , details |
| QUERY_INVALID | QUERY | ERROR | user_email , details |
| QUERY_SUCCESS | QUERY | INFO | user_email , details |
| QUERY_UNIMPLEMENTED | QUERY | ERROR | user_email , details |
| USER_CREATED | USER | INFO | user_email |
| COLLECTION_READY | COLLECTION | INFO | collections , details |
| COLLECTION_PAUSED | COLLECTION | INFO | collections , details |
| ORGANIZATION_INGEST_DISABLED | ORGANIZATION | WARNING | details |
| ORGANIZATION_INGEST_ENABLED | ORGANIZATION | INFO | details |
Query Logs
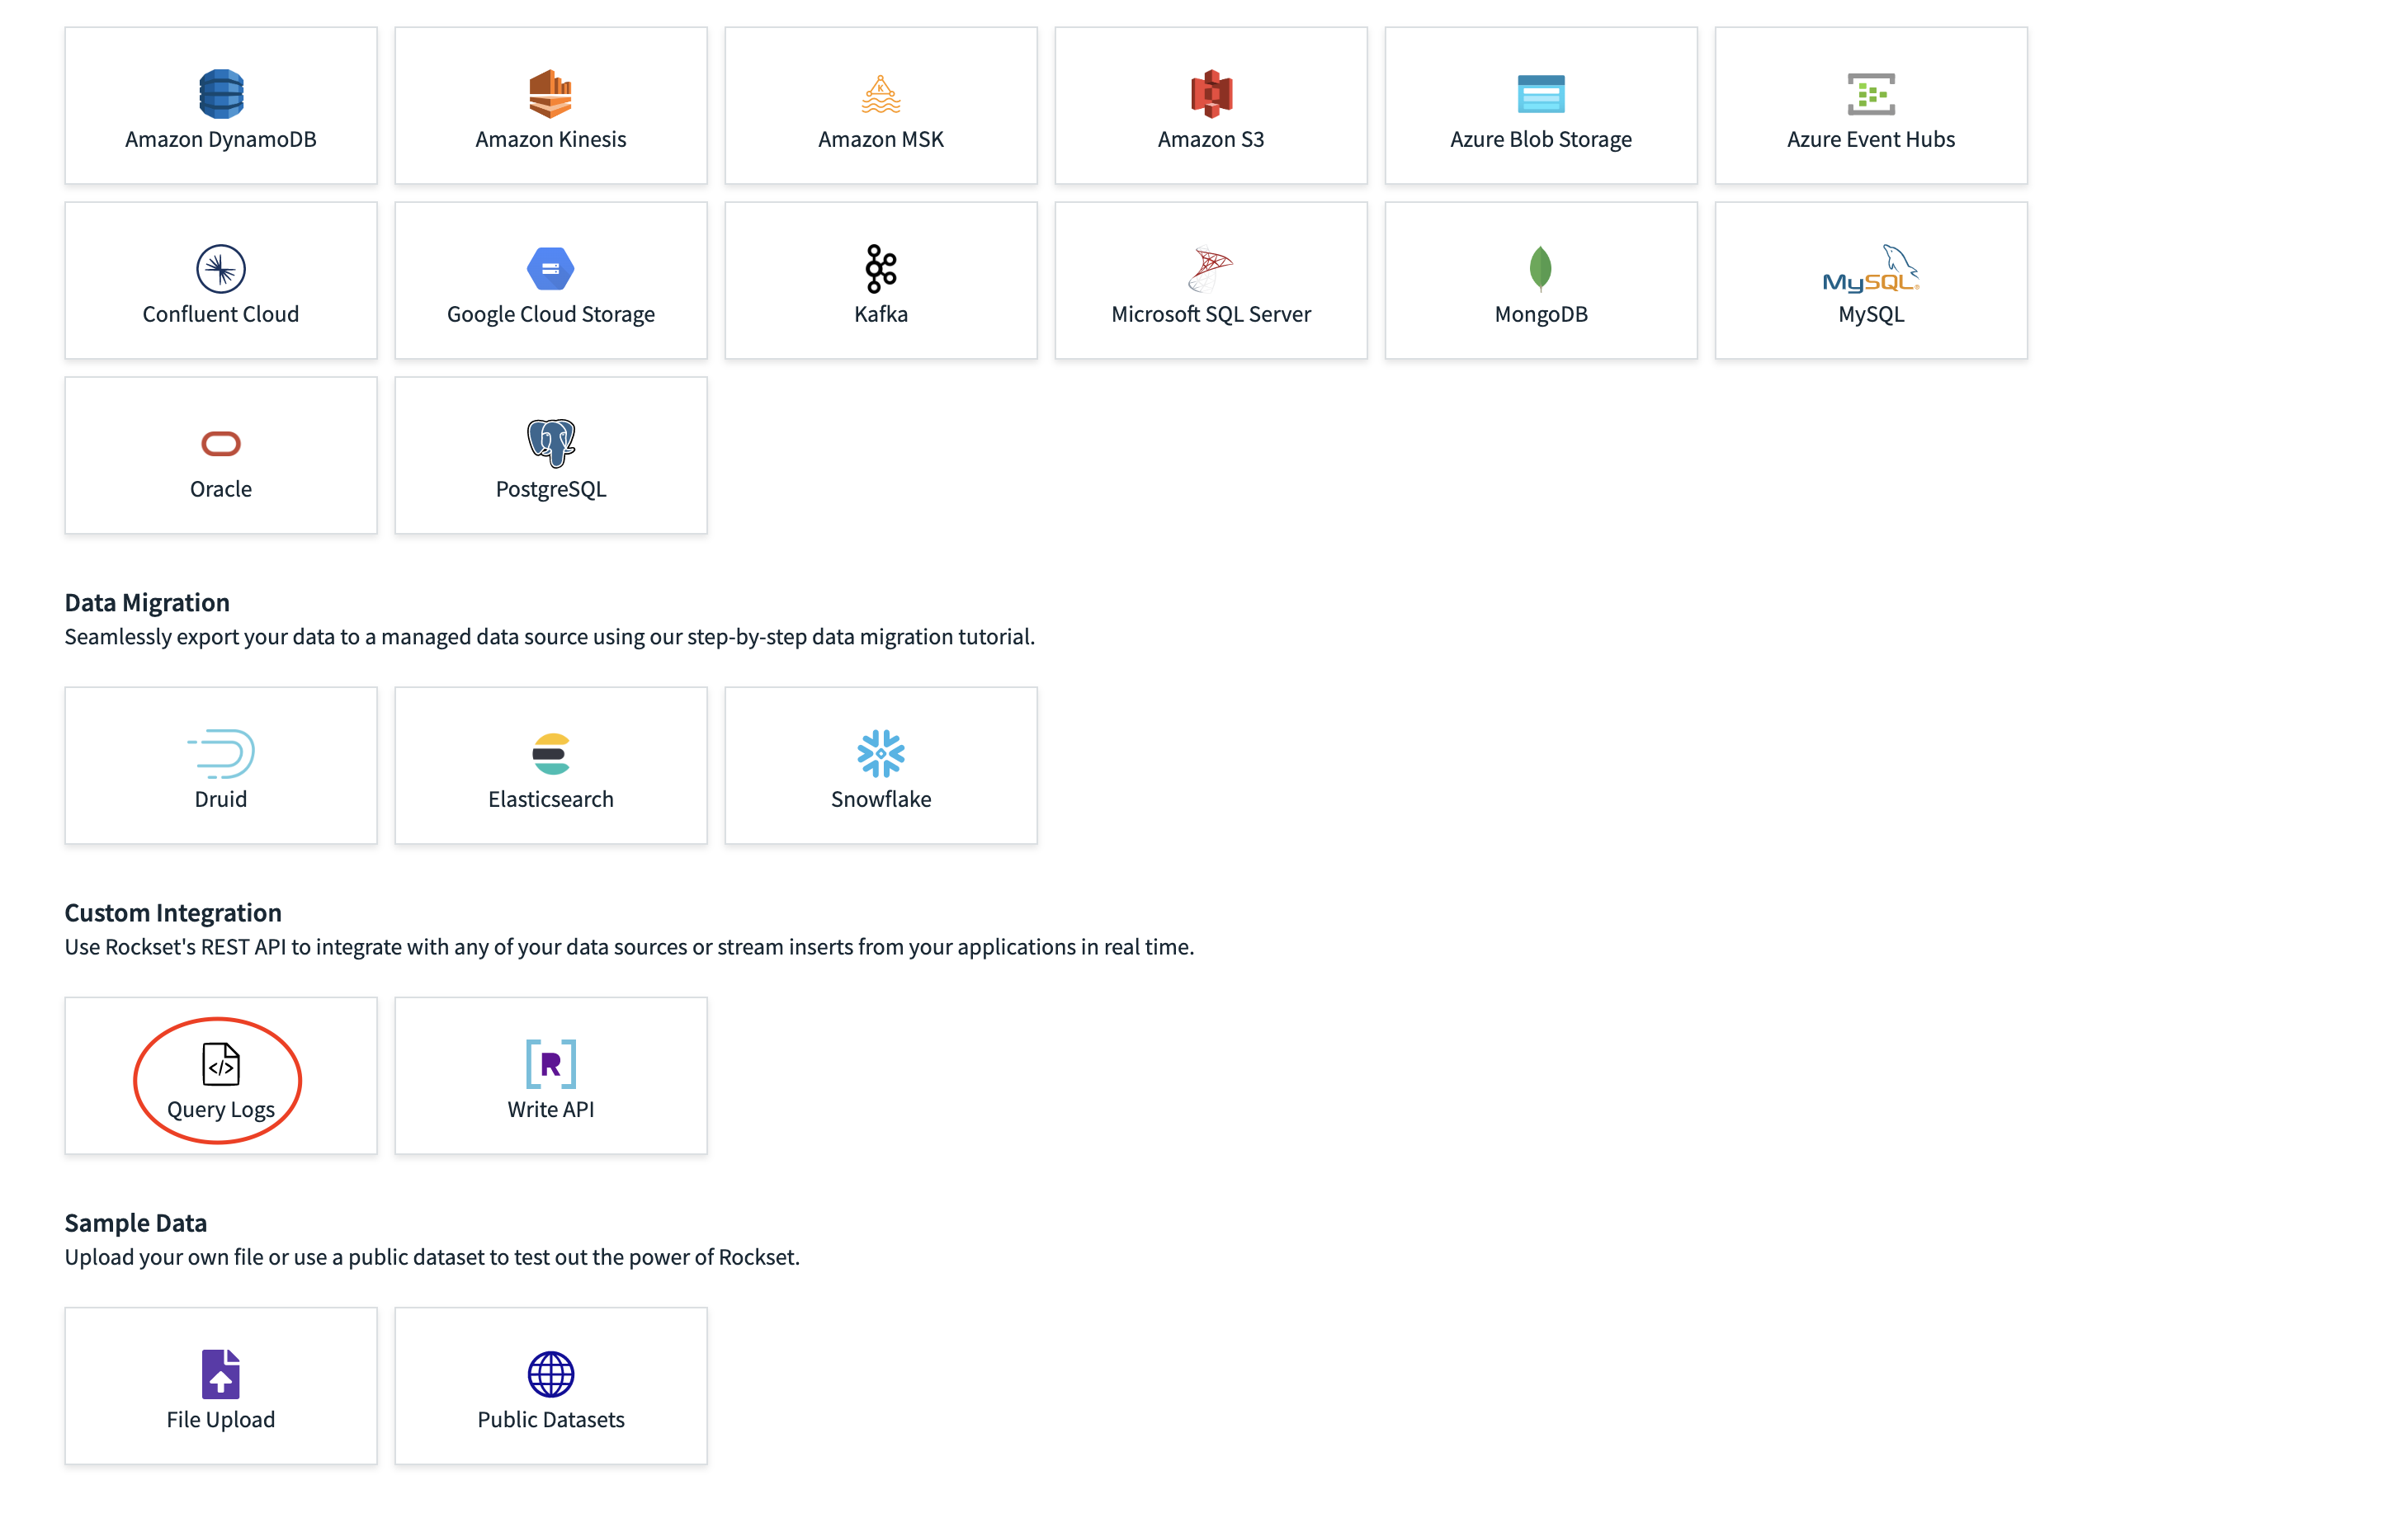
Query logs are designed to (1) help identify slow and/or compute-intensive queries as candidates for optimization and (2) trouble-shoot high query latencies and/or high CPU utilization. Query Logs show up as a new source option in your org. In order to enable this feature, you will create a new collection to view query logs of all your existing collections. During the source selection screen of the collection creation flow, choose "Query Logs".
During the collection creation process, you can configure the retention period for your logs just like you would with any other collection.
Query Logs rate limits
To protect your virtual instance, we limit log collection under high load. Logs that exceed this limit are dropped.
Privilege required to create Query Logs collection
Creating a collection with a query logs source requires the CREATE_QUERY_LOGS_COLLECTION_GLOBAL privilege. Only admins have this privilege unless you use custom roles.
Log types: INFO and DEBUG logs
After you have created the collection, logs of your queries will be ingested. All queries will receive INFO level logs (unless a rate limit has been reached). INFO logs contain some basic information about the query. However, INFO logs cannot be used with the query profiler. This is where DEBUG logs come into play. DEBUG logs contain extra data that allows them to be used with the query profiler.
In order to log DEBUG information with your query, you must add the debug_log_threshold_ms query hint to the end of your query text. You can also add the debug_threshold_ms parameter to your query or query lambda execution requests. If both the hint and the API parameter are provided, Rockset will always use the debug threshold specified in the API parameter.
SELECT * FROM _events HINT(debug_log_threshold_ms=1000)
DEBUG Logs Tip
Since DEBUG logs contain large amounts of data, we recommended using them sparingly. To prevent potential problems with Virtual Instances, limits are enforced on the rate that logs are recorded. INFO logs have a much higher rate limit than DEBUG logs.
Using the query profiler with DEBUG logs
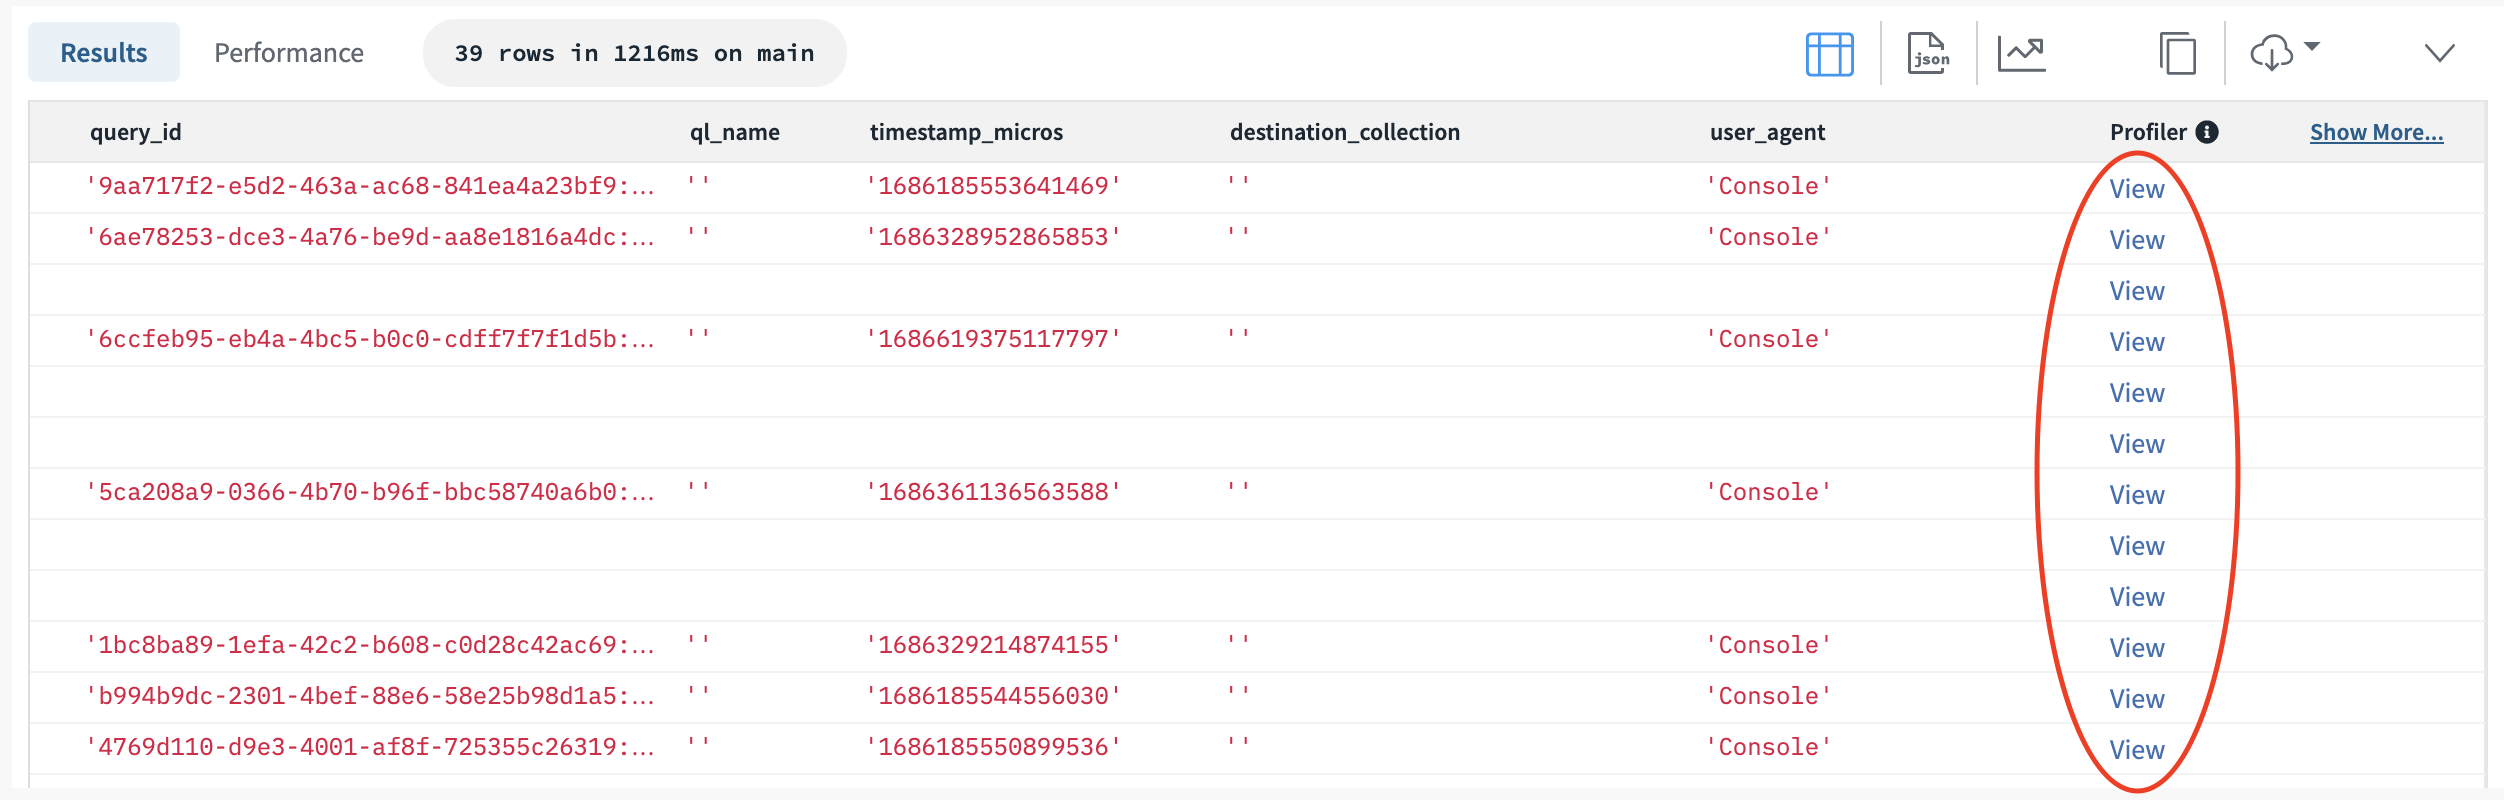
The extra information that is logged with DEBUG level logs allow you to generate a query profile. If the query editor detects that you are attempting to query a collection with a query logs source, a column called 'Profiler' will be added to the query results table. Any documents that have a populated stats field will have a link in this column. Clicking on this link will open the query profile in a new tab.
These profiler links can also be found in the documents preview of the collection details page.
Profiler Note
For this functionality to work correctly, both the
statsand_idcolumns must be included without any modifications within the results of your query. Renaming these columns using an ingest transformation or SQL alias will also cause issues for the profiler links.Furthermore, some DEBUG-level logs may not have the full query stats available because we were unable to fully aggregate the stats within a reasonable amount of time. In those cases, we will not display a button to open the profiler. We include this information in the
are_stats_completefield.
Log Structure
The basic information included with both types of logs includes:
- Query text
- Query lambda path (if relevant)
- Query parameters
- Query end state (status)
- User email (user_id)
- User agent
- Query runtime (runtime_ms)
- Throttled time (queued_time_ms)
- Completion timestamp (completion_timestamp_ms)
- Virtual Instance ID
- Virtual Instance Size
- Result count
- Client timeout (client_timeout_ms)
- Query timeout (timeout_ms)
Considerations
- Result count is only included for DEBUG-level logs.
- Queries that error before the plan is created will not be logged. This includes queries that reach their timeout threshold before leaving the queue.
Ingest Logs
Ingest Logs are currently in Beta.
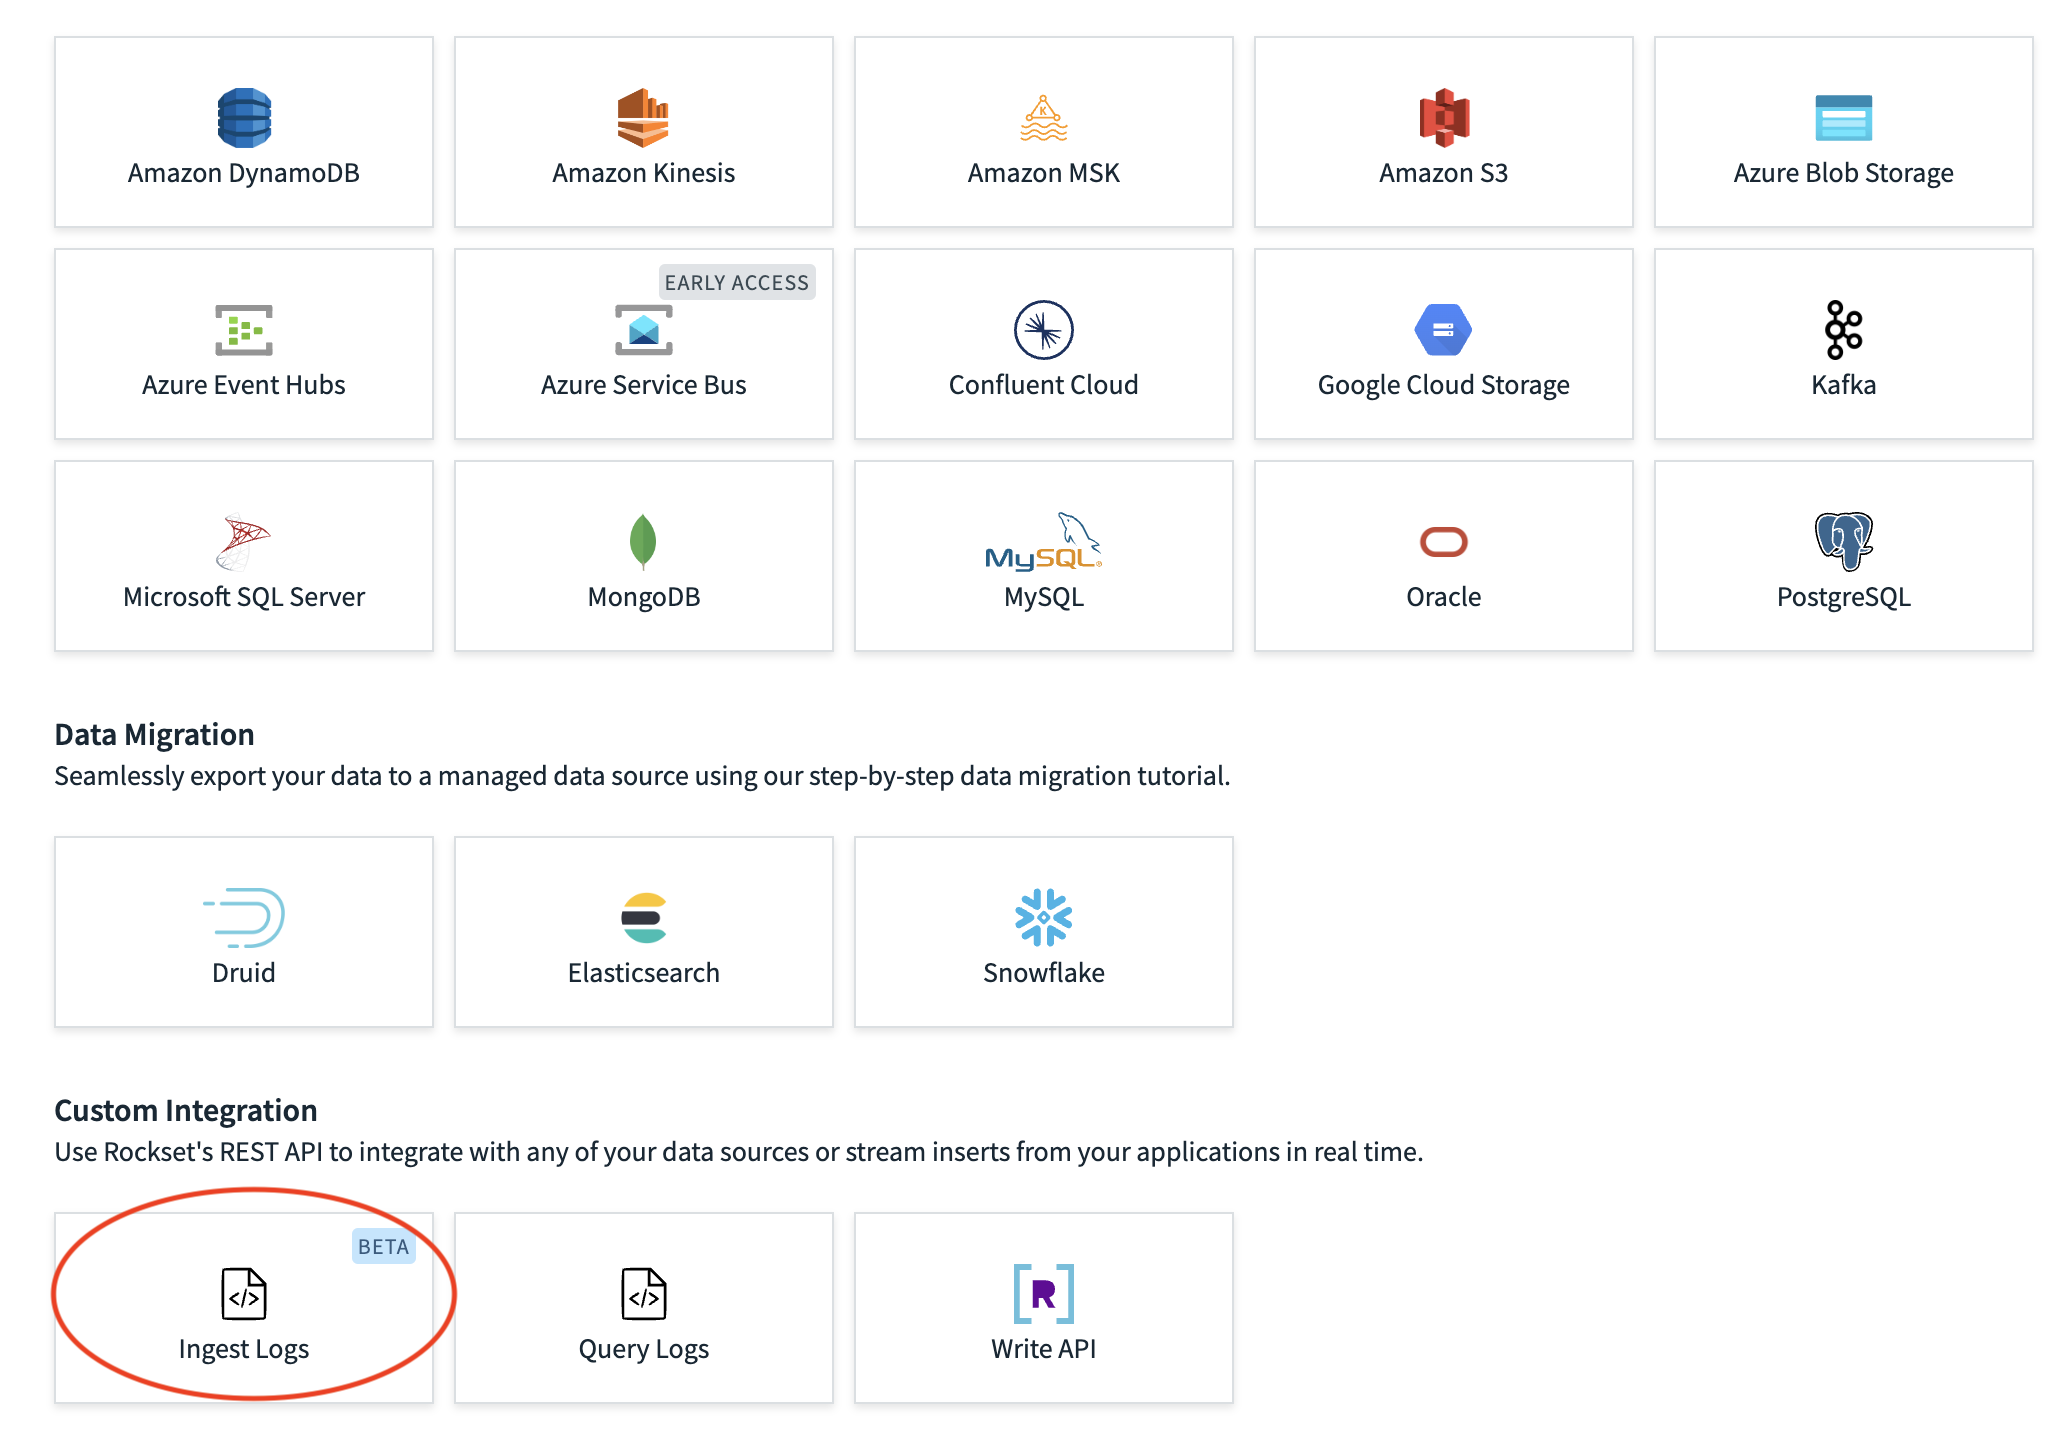
Ingest Logs enable you to record ingest errors into a dedicated collection for auditing and troubleshooting. Ingest Logs show up as a new source option in your org. In order to enable this feature, you will create a new collection to view ingest logs for all your existing collections. During the source selection screen of the collection creation flow, choose 'Ingest Logs'.
During the collection creation process, you can configure the retention period for your logs just like you would with any other collection.
Privileges required to create Ingest Logs collection
Creating a collection with an Ingest Logs source requires the
CREATE_INGEST_LOGS_COLLECTION_GLOBALprivilege. Only admins have this privilege unless you use custom roles.
Log Structure
The basic information included in logs are detailed below:
| Field | Definition |
|---|---|
message_log_type | The log type as described in the Log Types section. |
document | The document corresponding to the log. Included if the document was successfully parsed. |
document_metadata | Metadata corresponding to the document e.g. offset, path. This is not populated for Write API and File Uploads. |
message | The log or error message. |
_event_time | The time of event occurring. |
collection_path | Collection path for document being ingested. |
collection_rrn | Collection RRN for document being ingested. |
source_id | ID of source for document being ingested. |
Log Types
The log types currently supported are detailed below. This is the value populated in the message_log_type column of the log. Please reach out to Rockset Support if there are other log types you'd like to see.
| Type | Definition |
|---|---|
INGEST_TRANSFORMATION_ERROR | Error from an ingest transformation. The pre-transformed document is included in the log. |
PARSE_ERROR | Error from parsing or validation. The document is included if parsing is successful, but the document was invalid. |
DROPPED_SUMMARY | Summary of logs that were dropped due to ingest logs rate limiting. This rate limit is applied to reduce the ingest load on the VI and reduce storage costs. The summary log groups errors within a time window of several seconds. Message includes a breakdown of the log types and the number of documents that were dropped for each log type. The logged value may be lower than the actual number dropped. |
Ingest Logs Tip
Documents are included in the ingest logs due to their association with ingest errors. To enforce your existing permissions model, we recommend creating the Ingest Logs collection in a Workspace with proper access management rules set. Read Identity & Access Management for more information.
Ingest log events may take several minutes to appear in the collection after the error has occurred.
Updated 10 months ago