Query Lambdas Monitoring And Errors
This page covers the metrics tracked by Rockset for performance monitoring and errors with Query Lambdas.
Last Execution Metrics
Metrics on the last execution of a Query Lambda can be accessed by requesting them through the Rockset API and reading the stats value found in the API response, or by navigating to the Query Lambdas tab of the Rockset Console and then selecting your Query Lambda.
Information is available for the following metrics:
- Last Executed: denoted the timestamp of the last execution
- Last Executed By: denotes the email of the user associated with the last execution
- Last Execution Error: denotes the timestamp of the error surfaced by the last execution (if applicable)
- Last Execution Error Message: contains the error message associated with error surfaced by the last execution (if applicable)
Aggregated Metrics
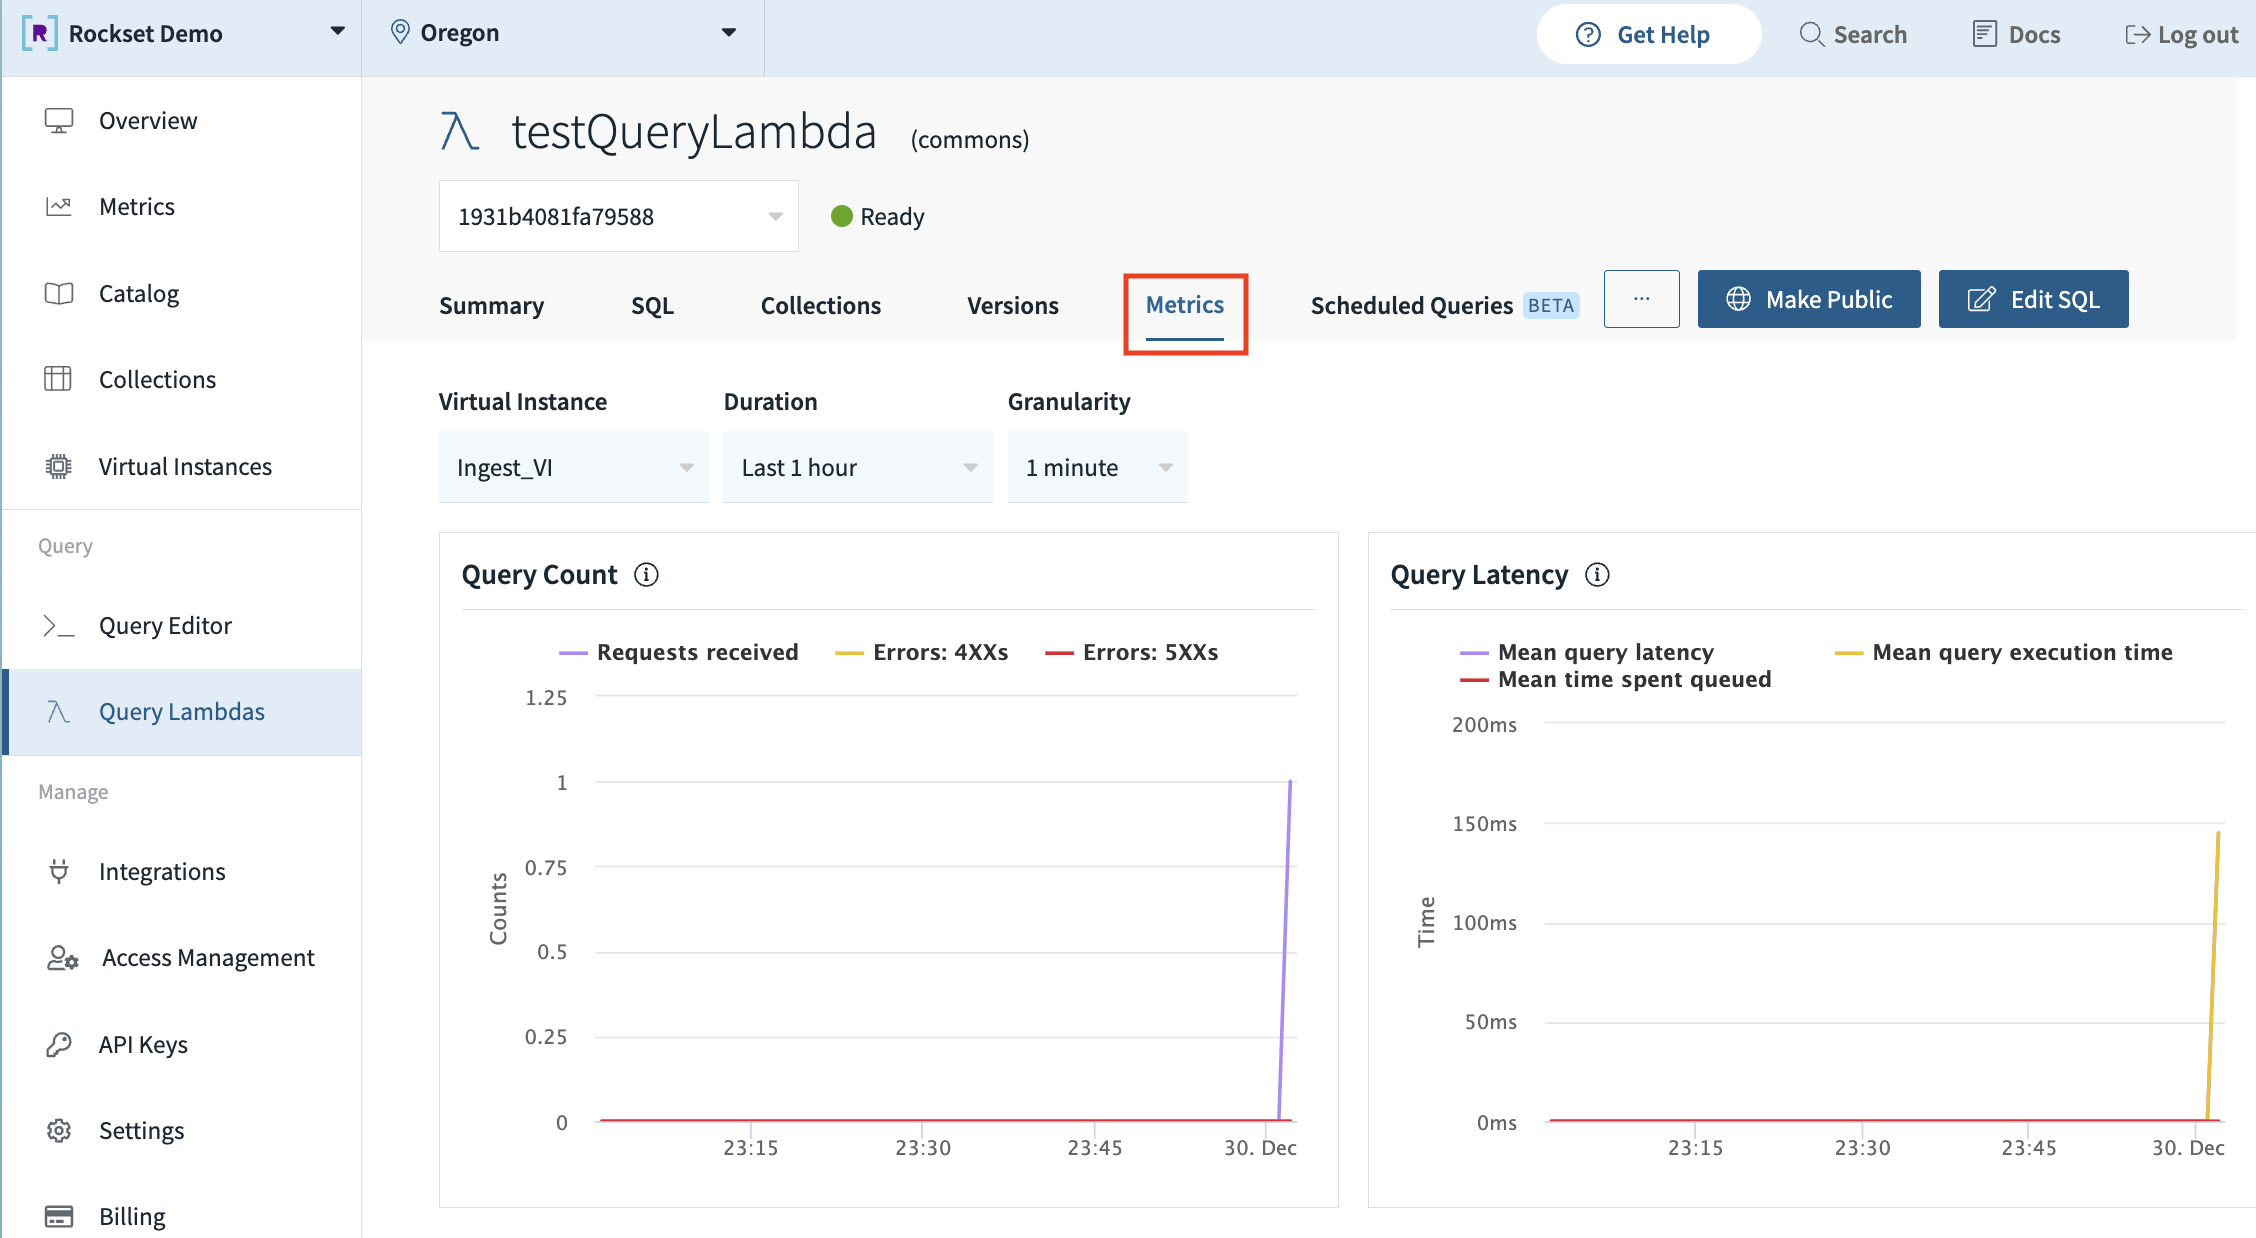
Usage charts showing aggregated metrics for individual Query Lambdas can be found by navigating to the Query Lambdas tab of the Rockset Console, selecting your Query Lambda, and then going to the Metrics tab.

From there, interactive graphs are available for the following metrics:
- Query Count, denoting the total number of query requests (via its REST endpoint) and the total number of errors over a specified time period
- Query Latency of all executions of the Query Lambda over a specified time period
Updated about 1 year ago
